Create Your Own Mid-Year Fantasy Team Assessment
We are going to need those TPS reports turned in by COB yesterday. That’s when the All-Star break officially ends. Did you think it was time to rest? Did you think it was time to relax with a nice piece of fictional literature by the pool? Wrong. Now is the time to assess how your team is performing.
Here are three easy steps you can put into practice to keep your foot on the gas and prepare yourself for success in the second half:
Step 1: Are your players returning value?
Remember the auction calculator? I wrote a beginner’s guide on how to use the auction calculator earlier in this year’s draft season. When you look at the auction calculator before the season begins, you are strictly viewing players based on whatever projection system you chose. But now, you can calculate dollar values based on what your rostered players have done so far, or in the year to date. Head over to the auction calculator, customize the outputs so that it matches your league, and take a look at the player value to date. I recommend clicking the “Export Data” button in the top right corner of the spreadsheet after clicking “Generate Projections”. Next, subset this dataset down to only include your roster. You can do this a number of ways, I like using python. Here’s some simple python code that accomplishes this task:
import pandas as pd

df_hitters = pd.read_csv('2022YTD.csv')

df_pitchers = pd.read_csv('2022YTD2.csv')

myteam_hitters = ['Aaron Judge', "Travis d'Arnaud", 'Paul Goldschmidt', 'Tommy Edman', 'Luis Arraez', 'Oneil Cruz','Joc Pederson', 'Yordan Alvarez', 'Jazz Chisholm Jr.', 'Trevor Story', 'Bryan Reynolds']

df_hitters.loc[df_hitters['Name'].isin(myteam_hitters)]
| Name | PA | mRBI | mR | mSB | mHR | mOBP | PTS | aPOS | Dollars |
|---|---|---|---|---|---|---|---|---|---|
| Aaron Judge | 389 | 5.0 | 7.4 | 1.0 | 7.9 | 1.9 | 23.1 | 7.5 | $31.20 |
| Paul Goldschmidt | 391 | 5.0 | 4.7 | -0.2 | 2.7 | 6.3 | 18.5 | 7.3 | $26.30 |
| Yordan Alvarez | 316 | 3.0 | 2.8 | -2.3 | 5.1 | 4.5 | 13.2 | 7.5 | $21.30 |
| Tommy Edman | 399 | -2.3 | 4.7 | 5.8 | -2.5 | -2.0 | 3.6 | 6.8 | $10.99 |
| Trevor Story | 342 | 2.7 | 0.7 | 1.8 | 0.7 | -4.3 | 1.5 | 4.7 | $6.84 |
| Jazz Chisholm Jr. | 241 | 0.1 | -1.9 | 2.6 | 0.3 | -1.0 | -0.1 | 4.7 | $5.25 |
| Joc Pederson | 266 | -0.3 | -2.7 | -1.1 | 1.5 | -0.8 | -3.4 | 7.5 | $4.69 |
| Luis Arraez | 348 | -2.9 | 1.5 | -1.5 | -3.3 | 5.4 | -0.8 | 4.7 | $4.51 |
| Travis d’Arnaud | 258 | -1.3 | -2.7 | -2.3 | -0.9 | -2.0 | -9.2 | 13.1 | $4.42 |
| Bryan Reynolds | 344 | -2.5 | -1.7 | -1.1 | 0.7 | -0.0 | -4.6 | 7.5 | $3.51 |
| Oneil Cruz | 104 | -5.5 | -8.6 | -0.6 | -3.7 | -2.5 | -20.9 | 6.8 | -$13.57 |
None of my players are costing me except for Oneil Cruz, but I picked him up right before his debut and therefore, his negative numbers don’t apply to my totals. In this sense, the auction calculator is a little unfair to players who are not in an everyday role, but you just have to recognize that. If you rostered Cruz all season and started him at shortstop before his debut, that’s your fault. The red markers are showing my worst player per category and the yellow markers are showing my best. Aaron Judge is good this year, huh? Travis d’Arnaud was a waiver claim after Salvador Perez went down, but he’s still returning positive value compared to other catchers.
myteam_pitchers = ['Max Scherzer' 'Raisel Iglesias', 'Nestor Cortes', 'Ryan Helsley', 'Luis Castillo',

'Tyler Anderson', 'Tanner Houck', 'Jon Gray', 'Cristian Javier']

df_pitchers.loc[df_pitchers['Name'].isin(myteam_pitchers)]
| Name | IP | mW | mSV | mERA | mWHIP | mSO | PTS | aPOS | Dollars |
|---|---|---|---|---|---|---|---|---|---|
| Ryan Helsley | 39.0 | -$0.53 | $1.37 | $3.88 | $3.64 | -$1.65 | $6.70 | $3.43 | $10.70 |
| Nestor Cortes | 95.2 | $1.21 | -$1.26 | $0.60 | $0.78 | $1.54 | $2.87 | $7.26 | $10.70 |
| Tyler Anderson | 97.1 | $3.83 | -$1.26 | -$0.87 | $0.53 | $0.17 | $2.40 | $7.26 | $10.23 |
| Cristian Javier | 78.1 | $0.34 | -$1.26 | -$1.67 | -$0.16 | $2.53 | -$0.23 | $7.26 | $7.60 |
| Luis Castillo | 78.0 | -$2.28 | -$1.26 | $0.03 | -$0.69 | $0.25 | -$3.95 | $7.26 | $3.88 |
| Jon Gray | 89.2 | $0.34 | -$1.26 | -$4.06 | -$2.02 | $1.62 | -$5.38 | $7.26 | $2.45 |
| Tanner Houck | 54.1 | -$0.53 | $0.71 | -$0.99 | -$2.65 | -$1.96 | -$5.42 | $3.43 | -$1.41 |
This table brings up three questions in my mind. First, is Tanner Houck worth keeping? Second, will Luis Castillo be traded? Finally, will Jon Gray start to get things going?
Step 2: Use xwOBA
Last year Jeff Zimmerman’s article on xwOBA had a big impact on my in-season strategy. If you can find a player on the waiver wire that has a higher xwOBA than someone you’re rostering, you should switch those two players out. Obviously, there are a few caveats, like don’t forget to pay attention to plate appearances, but this strategy works very, very well in daily-moves leagues like ESPN roto. We’re not all NFBC players, you know?
This technique is a little harder because it can be difficult to access a list of players on the waiver wire depending on your league. The league I care most about is my ESPN family and friend’s home league, these are the people I get to gloat or complain to in person, so it’s important I’m on the gloat side of things more than not. Unless I’ve totally missed something, and please let me know if I did, ESPN private fantasy leagues have no API that allows you to download up-to-date information on a regular basis. So, I typically just copy and paste a list of names on the waiver wire into this code:
# importing new external libraries

import pandas as pd

# grab the top X players from your waiver wire, sorted by

# whatever category you want, or whatever the default is

waiver = ['Yuli Gurriel','Jared Walsh','Jorge Soler']

# Players on my roster that I want to analyze

my_team = ['Justin Turner','Eddie Rosario','Brandon Nimmo']

# downloaded .csv from FanGraphs (limited to at least 200 PA)

df = pd.read_csv('xwOBARep.csv')

# using the lists I made above, creating two separate

# data sets and marking a column to indicate whether they

# are rostered or not

my_team = df.loc[df['Name'].isin(my_team)][['Name', 'xwOBA']]

my_team['flag']=1

waivers = df.loc[df['Name'].isin(waiver)][['Name', 'xwOBA']]

waivers['flag']=0

# combine the two data frames into one

frames = [my_team, waivers]

df2 = pd.concat(frames)

# sort based on xwOBA

df_final = df2.sort_values(by='xwOBA', ascending=False)

df_final
You need to download an xwOBA leaderboard with whatever PA threshold you feel comfortable with and you can use the FanGraphs leaderboard to do so. This code produces a very simple table that looks something like this:
| Name | xwOBA | Flag |
|---|---|---|
| Brandon Nimmo | 0.347 | 1 |
| Jorge Soler | 0.328 | 0 |
| Justin Turner | 0.322 | 1 |
| Jared Walsh | 0.295 | 0 |
| Yuli Gurriel | 0.273 | 0 |
Currently, Jorge Soler has a higher xwOBA than Justin Turner. It’s not much, but it’s higher. That’s one to make you think. You may notice that I’m rostering Eddie Rosario yet he is not showing up in this output. But, he’s under the 200 arbitrary PA threshold I set for myself, and therefore is not analyzed.
Step 3: Utilizing Rest-of-Season Projections (ROS)
Lastly, we have such excellent tools on this beautiful website and ROS projections are like the Phillips-head screwdriver in a fantasy manager’s metaphorical toolbox. Most of the projection systems on the“Projections” page should have updated ROS projections and you can stack those projections on top of what your team has already accumulated to get a clear picture of whether you are competitive with your current squad or not. Below, the red bars represent my team’s ROS totals and the blue bars represent what my team has already earned. This can only be done in roto leagues. The green bars represent my league’s history and the numbers, on average, a first-place team typically accomplishes. If you don’t have any league history, you may be able to go back into other, similar leagues to see what a first-place team’s totals typically come out to. 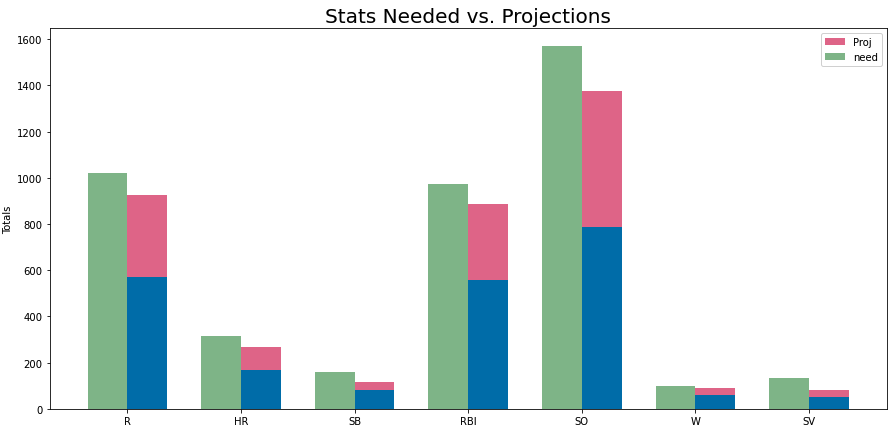
While these assesment measures may not apply directly to your league, you should be able to tweak them slightly to meet your needs. It’s really all about asking yourself how you have done so far and how you expect to do moving forward. Perhaps ROS projections are showing you that a player you’ve been relying on for homeruns is not expected to continue putting the ball out. Maybe you didn’t realize that there are three players whose xwOBA is much higher than one player on your roster. Whatever situation your team finds itself in, FanGraphs has so many tools available that will allow you to submit those TPS reports on time and avoid getting left in the dust in the second half. Good luck!
Interesting! However, I don’t see how ROS projections work. For example,Tatis is not included. Also, is there a way to convert these to $ values for each league?
I suppose it depends on the projection system. I’m sure each has its own way of projecting for the rest of the season, but my guess is that the technique is the same as pre-season projections. As for Tatis, maybe some are not yet projecting until there’s clarity behind his return.
The Auction Calculator has you define the settings of your league and you can do that before you click “Generate Projections”. You should be able to customize the output to your league.