Create A Counting Stat Pace Spreadsheet and Prepare to Win!
You don’t need machine learning, mathematical models, or even advanced projections to determine which counting stats you should focus on for the rest of the season. For some of our readers, this exercise will be elementary. For others, it may be just what you need to plan out the rest of the season. Start by copying and pasting your league counting stats into an excel spreadsheet so that it looks something like this:

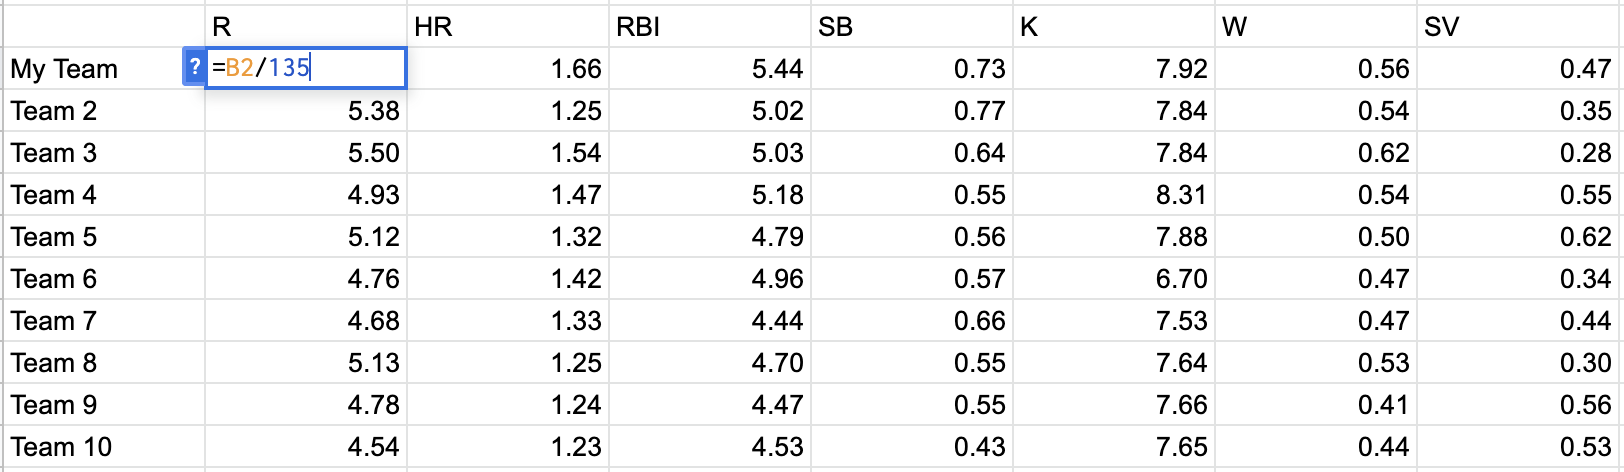
Next, divide each cell by the number of days where at least one MLB game was played. If my math is right, there have been 135 baseball days so far this season (as of August 23rd). If you take your total points for counting stats and divide each by 135, you’ll see how many runs, rbi, home runs, stolen bases, strikeouts, wins, and saves your team has been recording on a daily basis.
It should look something like this:
From there, you have a sense of what your team and your opponents’ teams are recording on a daily basis. If we look at “My Team” as an example, you can see that the boys have been boppin’ and I’m not fearful of losing my home run lead. But, here’s an example of why this process is informative. My saves pace is at 0.47, which is lower than four of my league mates. One might think, “Oh no! I need to trade for saves!” But, if you look at the above table in conjunction with my ranking and those close to me, you’ll see that I shouldn’t be too worried:

If I stay at my current pace, I likely won’t catch Team 10 and move up a roto point (from 6 to 7), but I also likely won’t be caught by Team 7. Certainly, that is under the assumption Team 7 doesn’t increase their pace. I would need to go and look at Team 7’s roster to see if there have been any major changes to really feel comfortable holding my score of six, and I can easily do that. But, let’s say I want to overtake Team 10. Team 10 is named Team 10 because they are in 10th place. That means maybe they would be willing to trade away some saves to make it out of the cellar. Can I take advantage of that? On Team 10’s roster is Garrett Whitlock, a Committee Closer reliever who has a steamer rest of season saves projection of four. If I were to trade away a hitter for Whitlock, I would be adding four more saves to my projected end-of-season total. I can calculate that total by taking my pace (0.47), multiplying it by the number of game days left in the season (46), and then adding four. I can do the same with Team 10, but instead, I’ll subtract four. That leaves me with the following:
My Team projected end-of-season saves: 109.2
Team 1o projected end-of-season saves: 115.8
Acquiring Garrett Whitlock would be a mistake as I wouldn’t be able to surpass Team 1o even if I did trade for those four saves. What if I pushed the envelope a little more and went for a bigger closer on Team 10, Emmanuel Clase? The same process as before but this time with an added nine saves instead of four would take place, leaving me with the following:
My Team projected end-of-season saves: 114.2
Team 1o projected end-of-season saves: 110.8
Now, we’re getting somewhere. The enormous caveat here is that I’m assuming everything else is equal, or in other words, I didn’t trade away offense. If I were to trade away a pivotal offensive piece, and I would have to do just that in order to get back Clase, I would have to work through the numbers to see what I would be losing and if I had enough cushion to be ok. So let’s try it. Let’s experiment with trading away Paul Goldschmidt. What I have to do is look at the next best team in home runs, runs, and rbi and calculate their projected end-of-season totals if they stay on pace, just like I did with the saves. I do the same thing for my team, but I subtract Goldschmidt’s steamer rest-of-season projections from my totals to see how my team shapes out after trading him away. I’m ignoring stolen bases because Goldschmidt is only expected to swipe one more bag the rest of the way. When I calculate expected end-of-season results and compare them to the teams nipping at my heals, here’s how things pan out:

A trade for Clase may gain a save category point, but it also will likely drop a point in the run category. This isn’t really an apples-to-apples comparison as I did not factor in on-base percentage, or other pitching categories like strikeouts, wins, WHIP or ERA. You could argue that the addition of Clase may help my case in pitching beyond just saves, but it could also do the opposite if he were to go through a rough patch. Regardless, this exercise gives me comfort in the fact that I don’t really need to do anything with my saves score unless something major changes.
I believe what I’m describing here is something similar to standing gains points and Tanner Bell does a great job of supplying tools to use that system over at Smart Fantasy Baseball. But if you start simple, with a counting stats pace spreadsheet, you can go down a few analytical rabbit holes that leave you staring at your screen for way too long when you could have just been watching and enjoying baseball instead. Hopefully, you can find some portion of this exercise useful and utilize pace in conjunction with rest-of-season projections to finish strong in your roto leagues.
But for roto and points leagues, a daily rate is nearly useless if a team’s IP/G per day varies from the max, especially for pitching categories. If you’re on pace for 1650 innings and you calculate a daily rate, you’re going to overcalculate your pitching categories by 10% in a 1500 IP league.
So this is not elementary, it’s likely wrong. It might be okay if you are on pace to be short of the IP/G cap, but even then, you’re likely to try to catch up. This would be significantly improved if you divided by G or IP instead of days, then multiplied by the lesser of projected G/IP or the league cap. I know that’s slightly more complicated, but it’s not rocket surgery and it’s way more accurate than dividing by days.
I see what you’re saying, but calling my process “wrong” is an exaggeration. I’ve used it with effectiveness in the past. Use G/Days/IP/BIP/Number of sunflower seeds spit onto the field, the idea is the same. It’s a useful strategy that can be tweaked to match your specific situation
Yeah, not “wrong” but in a league with innings limits (or position limits) it’s important to be aware of which teams might be riding high in the standings due to being way ahead of the playing time curve.
It’s really only another step or two to figure W/Sv/K on a /INN basis, and throw in an INN/Days factor to figure out what’s left.
True enlightenment comes when you also build out rest-of-season projections based on league rosters. It’s the exact same thing, really, except with (162-G) as your denominator. Add that to year-to-date and you’re cooking!
Also, the simplest way to figure “Baseball Days” is to set the first day of the season in one cell, the last day in another, and have a third cell that just display’s today’s date, and calculate the difference continuously
But when would this analysis ever predict movement in the standings? The person in first place in HR will also have the highest HR/day rate, the person in second would have the second-highest, etc. Dividing all of the stat totals by the same denominator would just suggest every team will stay in the exact same position the rest of the way (in other words, your saves rate is always going to be a little slower than the team ahead of you and a little better than the team behind).