Choose Your Right-Handed Starters Wisely
Last week we got a little more granular in evaluating our pitching matchups, focusing on how teams have fared against left-handed pitchers, both in terms of overall offense, as well as against individual pitch types. So, in the name of symmetry, let’s move on to right-handers this week, trying to identify weaknesses for matchups this weekend and in Week 19 of fantasy.
No time to waste, let’s go.
We’ll do this by first looking at how each team has fared by the handedness of the pitcher faced, ranking teams in wOBA, xwOBA, wOBA/xwOBA (on contact), SwStr%, Whiff%, and BB%. Baseball can always baseball at any given time but looking at these ranks gives us a good starting point for how teams have generally succeeded (or failed) against certain hands, both in overall damage and whiffs.
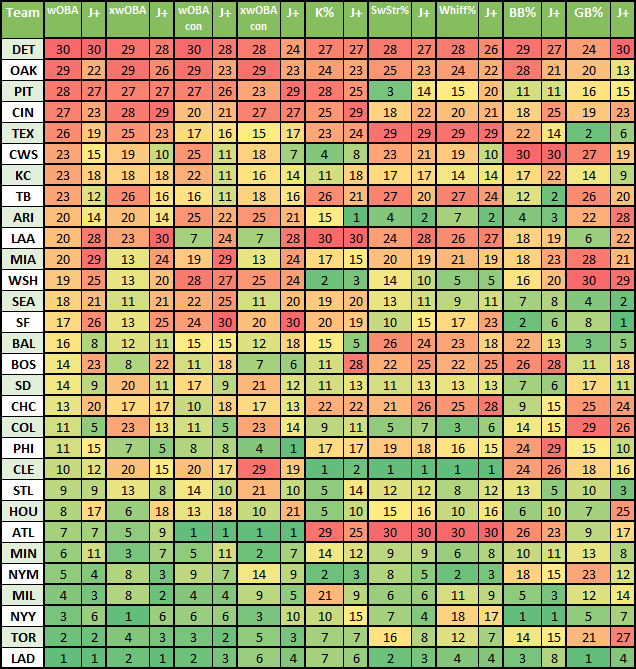
Through August 10, here is how each team ranks vs RHP in the aforementioned categories:

One of These Sides is Not Like the Other
When choosing your streamers, don’t make the mistake of always assuming that any matchup against one of the worst teams is a good idea because some offenses can be lopsided, depending on the pitcher’s handedness. But, to be fair, there are teams that make those assumptions safer. Two, actually, as that’s how many teams are currently in the bottom-10 of wOBA when facing both RHP and LHP:
Oakland (29th overall): 28th vs LHP, 29th vs RHP
Pittsburgh (28th overall): 27th vs LHP, 28th vs RHP
In terms of offensive lopsidedness, first, here are the teams that are at the bottom of overall wOBA but have a significant split when comparing each hand:
Detroit (30th overall): 20th vs LHP, 30th vs RHP
Miami (27th overall): 30 vs LHP, 20th vs RHP
We also have teams that are average to above-average vs LHP but are in the bottom-10 vs RHP:
Chicago White Sox (t-16th overall): 8th vs LHP, 23rd vs RHP
Texas (t-19th overall): 10th vs LHP, 26th vs RHP
Cincinnati (t-19th overall): 14th vs LHP, 27th vs RHP
And finally, there are two teams with at least a gap of at least 15 in their ranking between the hands:
Milwaukee (t-6th overall): 25th vs LHP, 4th vs RHP
Cleveland (t-16th overall): 29th vs LHP, 10th vs RHP
Ok, so going by the above, we’re picking on Oakland and Pittsburgh (duh), as well as Detroit (who is actually better vs LHP), while being more careful with Miami than we might be with left-handers – and that goes double for trying to sneak suspect righties past Milwaukee. But while we can lower the bar when facing the White Sox, Reds, and Rangers, the Guardians should not always be trifled with.
However, these are all season-long numbers, so perhaps we should also check in on some recency bias to see who’s hot and/or not. Using an arbitrary endpoint of June 1 (J+ on the chart), here is how teams have fared recently compared to their total numbers:
Since we are dealing with arbitrary endpoints that could shift the results greatly depending on the dates selected, I wouldn’t get too bogged down by all of the changes, focusing instead on those with the higher magnitudes, changes that represent a shift into a whole other section of the spectrum, and general consistency, whether positive or negative.
Cold Then, Cold Now, Cold Forever
Detroit Tigers (wOBA: 30th to 30th)
Pick a stat, any stat, from the chart above and you’ll likely find Detroit at the bottom, whether for the season or since the summer started. T-I-G-E-R-S, that spells can’t hit right-handers.
Pittsburgh Pirates (wOBA: 28th to 27th)
We’re moving divisions and leagues but don’t the Pirates just feel like they should be in the AL Central? Regardless, the Pirates don’t do much versus righties, lefties, or anyone in between. Bottom-five rates on contact or not, the best thing you can say about them is an elite SwStr% vs RHP (3rd). But is that swing stinginess really working out if their K% vs RHP is 25th since the start of June and 28th for the year?
Still Cold, Technically Warmer
Oakland Athletics (wOBA: 29th to 22nd)
Wow! Oakland has almost been out of the bottom 10 in wOBA since the start of June! Yeah, call me skeptical in regards to the A’s being any better than the bottom-three offense they’ve been all season. Their wOBA might be up but their xwOBA is still in the bottom five and most of the weight of their goodness vs righties has been carried by just two players. Seth Brown has a .384 wOBA and Sean Murphy has a .356 wOBA vs RHP since June 1. Ramon Laureano is in third place way back at a .314 wOBA, and things go quickly downhill from there.
Cincinnati Reds (wOBA: 27th to 23rd)
Yes, the Reds have slightly improved but, like Oakland, have expected stats that haven’t much budged, along with a K% that is 25th for the season and 29th since the start of June. But more importantly, this Reds offense is much different than what they had prior to the trade deadline, with Brandon Drury (.349 wOBA vs RHP) and Tyler Naquin (.375 wOBA vs RHP) gone to greener pastures. But hey, so did Tommy Pham (.291 wOBA vs RHP)?
Once Cold, Currently Freezing
Los Angeles Angels (wOBA: t-2oth to 28th)
It’s almost like things are likely to go downhill any time Mike Trout is out of the picture. But we can’t even blame all of the downturn on his absence, considering he didn’t go on the IL until July 13. No, the real blame for the dip should point towards those like Jared Walsh (.232 wOBA, 32.9% K% vs RHP since June 1), Brandon Marsh (.252 wOBA, 39.5% K%), and Andrew Velazquez (.207 wOBA, 45.7% K%). But in the end, the realest of the dips still belongs to Arte Moreno.
Miami Marlins (wOBA: t-20th to 29th)
The Marlins have been awful vs lefties all season but at least they weren’t as inept against right-handers. At least, until lately. To be fair, the fish have been racked by injury, with Jazz Chisholm Jr., Jorge Soler, Jon Berti, and others, all currently on the IL. But what’s the excuse for Miguel Rojas (.267 wOBA vs RHP since June 1), Jesús Aguilar (.271 wOBA), and Bryan De La Cruz (.267 wOBA)? Trick question; they’re Marlins.
Less Tighty Vs Righty
Chicago White Sox (8th vs LHP, 23rd vs RHP)
Texas Rangers (10th vs LHP, 26th vs RHP)
Lefty Prey, Righty Predator
Milwaukee Brewers (25th vs LHP, 4th vs RHP)
Cleveland Guardians (29th vs LHP, 10th vs RHP)
Okay, maybe they’re not quite Predator but perhaps we can give them Predators? Milwaukee and Cleveland (in particular) are both solid targets with a left-handed starter but we’ll have to be a lot more careful with right-handers. The Guardians have much better overall offensive numbers but also have some of the stingiest strikeout rates in baseball, both for the season and over the past 2+ months, while the Brewers are 8th in xwOBA, and top-five in both wOBA and wOBAcon,
Pitch by Pitch
Alright, now we have which teams have been worst against right-handers for the season, who has struggled more recently, and which teams have a gap between what they were and what they are. That’s a pretty good start but let’s go one step deeper, looking at how teams have fared vs individual pitch types.
Is it good to know that the Angels vs RHP have ranked last in K% for the season, as well as since June 1? Yes! Is it even more useful to know that their biggest whiff rates (by a wide margin) are against four-seamers and changeups? I think so. Is it most useful to make just one more joke about Arte Moreno utterly failing their fanbase by wasting the primes of two of the best players in generations? Also yes!
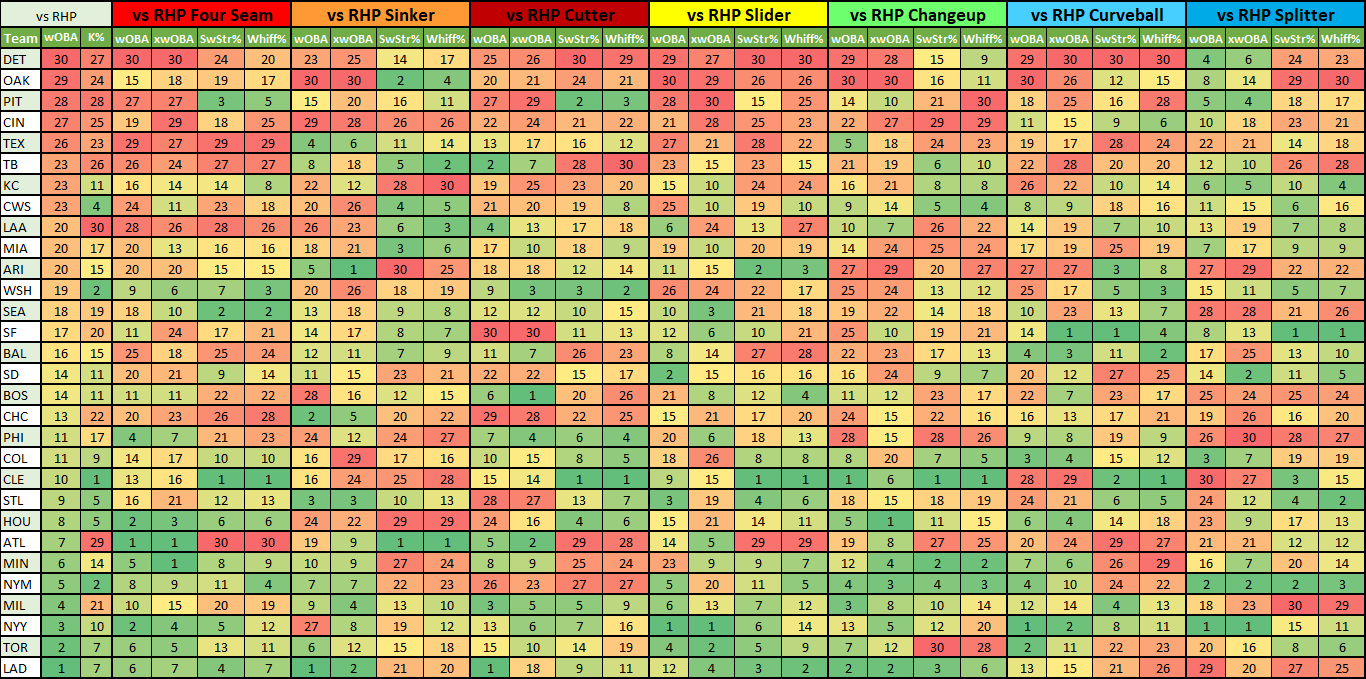
Ordered by overall rank in wOBA vs RHP (and including rank in K%), here is how every team ranks vs right-handed pitch* in wOBA, xwOBA, SwStr%, and Whiff% through August 10.
*A note about splitters: Keep in mind that we’re dealing with the smallest samples of the batch, with the spread of right-handed splitters faced going only 336 (Arizona) to 140 (Pittsburgh). Compare that to, for example, changeups, which have a spread of 1656 (Washington) to 930 (Miami). Just something to remember.
Target: Detroit Tigers
Least Offense vs: Everything. No, seriously. They’re in the bottom five of wOBA/xwOBA against virtually every pitch type.
Most Whiffs vs: Cutter, Slider, Curveball
Most Offense vs: Splitter? Also, they’ve only seen 191 of them all season, so-ooo…
Fewest Whiffs vs: Sinker, Changeup
The Weekend: Michael Kopech, Lucas Giolito, Lance Lynn
Week 19: Aaron Civale, Zach Plesac, Cal Quantrill
All of the pitchers above easily clear the bar of starters worth streaming against the Tigers but I’ll bet on Lance Lynn having the best outing from the Chicago trio. Lynn’s 4.71 ERA (5.11 FIP) over the past 30 days isn’t much to brag about but a 2.81 SIERA and 1.00 WHIP make the period a lot shinier and his best pitches this season (four-seam/slider) line up well with what Detroit really struggles with.
All of the Cleveland starters are also viable but the most interesting might be Zach Plesac, who just dominated them on Thursday in Detroit for 6.1 IP, allowing 1 ER and striking out seven. Plesac only had a 14% SwStr% overall but his slider ran a 43% SwStr%, generating six whiffs on 14 pitches and nine swings. That tracks, considering the Tigers are 30th in SwStr% and Whiff% vs righty sliders.
Plesac’s slider is now up to a 21.1% SwStr% in 2022, which is still shy of the 25.9% it ran in 2020 but is also up three points from last season. Here’s to hoping we see more of these next week:
Target: Pittsburgh Pirates
Least Offense vs: Four-Seamer, Cutter, Slider
Most Whiffs vs: Slider, Changeup, Curveball – But all three have a commonality, in that the Pirates have really high Whiff% but mid-range SwStr%.
Most Offense vs: Sinker, Changeup, Splitter (n=140)
Fewest Whiffs vs: Four-Seamer, Cutter
The Weekend: Logan Webb
Week 19: Nick Pivetta, Nathan Eovaldi, Graham Ashcraft, Justin Dunn
If the Pirates can survive Carlos Rodón on Friday, they might have a better chance against Logan Webb. Relatively speaking, of course.
Pittsburgh has had their best results against sinkers (Webb’s bread-and-butter) and their worst against sliders, which have run lesser results for Webb lately, posting a -2.2 pVal (SC, per 100 pitches) that is down from its 0.4 mark for the whole year. And the Pirates also have better numbers against changeups, Webb’s other secondary, which has also dropped in pVal over the past month, compared to for the season. However, it’s still the Pirates, so let’s not get too crazy on optimism.
The Boston boys have really struggled as of late, with Nick Pivetta running a 6.23 ERA in 26 IP over the past month and Nathan Eovaldi somehow coming in even worse, with a 7.11 ERA over 25 IP. But both work with four-seamers (which is the better fastball to have against Pittsburgh), curveballs (against whom the Pirates are 25th in xwOBA and 28th in Whiff%, and sliders (28th in wOBA, 29th in xwOBA, 25th in Whiff%).
Graham Ashcraft is on a nice, little roll, running a 1.74 ERA (3.94 FIP) but only striking out 12 over 20.2 IP. He’s a cutter-first pitcher, with a slider/sinker rounding things out but none of them get very many whiffs – a 12.8% SwStr% from his slider leads his pitch mix, with the cutter and sinker both coming in sub-7%. The Pirates are always streamable but this one feels dicey, especially after two good starts that felt like FIP-mirages.
Justin Dunn also rolls with a 4S/SL/CU pitch mix that sets up well against Pittsburgh and while he only just made his season debut against the Mets (4.2 IP – 3 ER – 2 K), the one-game sample of curveballs did come with a 25% SwStr%.
Target: Oakland Athletics
Least Offense vs: Sinker, Slider, Changeup, Curveball
Most Whiffs vs: Slider, Cutter, Splitter (n=265)
Most Offense vs: Four-Seamer, Cutter, Splitter
Fewest Whiffs vs: Sinker, Changeup, Curveball
The Weekend: Luis Garcia, Lance McCullers Jr., Cristian Javier
Week 19: Glenn Otto, Dane Dunning, Logan Gilbert, Luis Castillo
Boy-oh-boy, the A’s have a lot of slip-sliding coming over the horizon, with every right-hander they face after Luis Garcia averaging at least 20% usage on their sliders. But Cristian Javier might have the best and its 1.1 pVal (SC, per 100) for the season is up to an elite 4.4 over the past month. And while Javier’s 28% K% over that month is down from a 32.5% K% for the season, his chase rate has jumped from a ho-hum 28.7% oSw% to an upper-level 34.2% oSw%.
Javier’s slider usage has been well over average in his past three starts (including 28% usage vs OAK on July 27) and the A’s should probably count on being fed a lot more on Sunday.
Glenn Otto has had more success with his four-seamer over the past month (0.0 to 1.2 pVal per 100 pitches) but his sinker (26% usage) has stayed steady at a 1.4 pVal per 100 all season. Hopefully, he’ll lean on it against an Oakland offense that is 30th against it in both wOBA and xwOBA.
And Otto’s biggest whiffer is a slider (16.0% SwStr%, 29.4% CSW%) that Oakland is 30th in wOBA, 29th in xwOBA, and 26th in SwStr%/Whiff% against.
Seth Brown already knows:
“Hey! My slider gets just as many whiffs as Glenn’s…What about Dane?” Yeah, man, you’re right. But you’re also maddeningly inconsistent and I hate starting you.
I’m sorry, that was harsh, Mr. Dunning; here you go:
Target: Cincinnati Reds
Least Offense vs: Sinker, Four-Seamer, Slider, Changeup – The latter three are all similar in that the Reds have a wOBA against them ranked around 20ish but are backed by bottom-three xwOBAs. Considering the drain of bats brought by the trade deadline, I’d bet more on things continuing to move more towards the expected side of things.
Most Whiffs vs: Slider, Changeup
Most Offense vs: Curveball, Splitter (n=210)
Fewest Whiffs vs: Curveball
The Weekend: Adrian Sampson 샘슨, Keegan Thompson
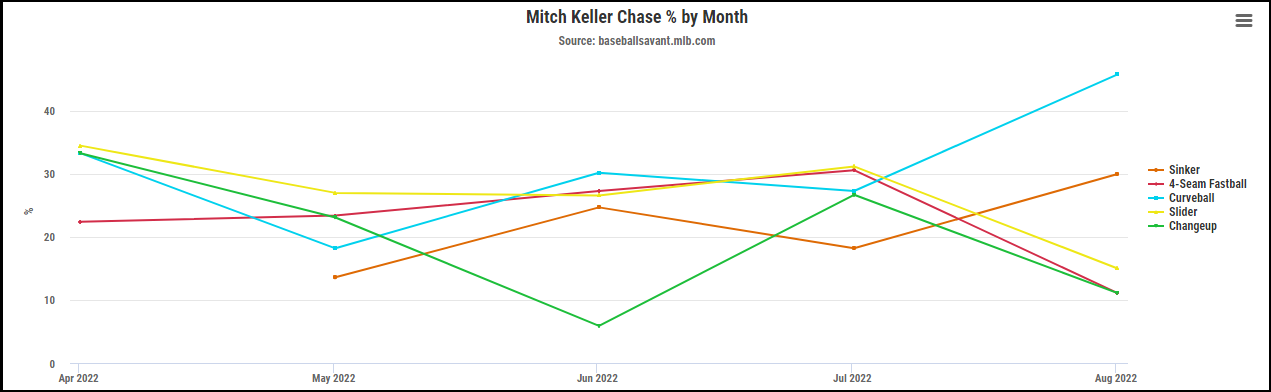
Week 19: Noah Syndergaard, Kyle Gibson, Tyler Beede, Zach Thompson, Mitch Keller.
Mitch Keller and his fancy, new sinker are a good bet to succeed against a Reds team that has it’s worse overall numbers against the pitch. But with Keller’s sinker success has come better results for his slider and curveball, both of which have dramatically increased their pVals over the past month.
Along with the sinker, Keller’s curveball, in particular, has generated significantly more chases:
Hey, Darick…What the hook gonna be?
The Reds do poorly against Kyle Gibson’s best three pitches by pVal (sinker/four-seamer/cutter) but they also love whiffing against changeups (29th in SwStr%, 29th in Whiff%), which, for Gibson, has generated a 14.6% SwStr% in 2021, up from 13% in 2021.
And when it comes to Gibson, what is dead may never die:
Target: Los Angeles Angels
Least Offense vs: Four-Seamer, Sinker
Most Whiffs vs: Four-Seamer, Changeup
Most Offense vs: Cutter, Changeup
Fewest Whiffs vs: Sinker, Curveball, Splitter (n=212)
The Weekend: Tyler Mahle, Dylan Bundy, Chris Archer
Week 19: Luis Castillo, George Kirby, Matt Manning, Drew Hutchison
Target: Miami Marlins
Least Offense vs: Miami spreads out their mediocrity, with wOBA rankings between 17 and 20 against every pitch except changeups (14th) – which, incidentally, they’re 24th in xwOBA.
Most Whiffs vs: Changeup, Curveball
Most Offense vs: See; Least Offense.
Fewest Whiffs vs: Sinker, Splitter (n=177)
The Weekend: Jake Odorizzi, Ian Anderson, Spencer Strider
Week 19: Joe Musgrove, Mike Clevinger, Ryan Pepiot
Amazing amount of work. Congrats.
Thank you so much, I appreciate you checking it out.