Archive for Roto Awards

Hitter Auction Calculator Awards: Don’t Call Me a Rabbit

To qualify for this totally made-up award, a player must have been projected to earn positive value in the stolen base category (mSB) on our Auction Calculator (default settings, steamer projections) and negative value in every other category. They then needed to earn positive value in at least three of the four non-SB categories (mR, mHR, mRBI, mAVG).

Finalists: Bobby Witt Jr., Daulton Varsho, Dansby Swanson

Finalist #1: Bobby Witt Jr., Projected negative: mAVG, mHR, mRBI, mR. Earned positive: mHR, mRBI, mR, mSB

Surely there will be plenty written about Bobby Witt Jr.’s rookie season in fantasy realms this offseason. His preseason projections were likely low due to the uncertainty of his playing time/call-up situation. It was clear that he was going to be good. But, would you have guessed he’d finish as the fifth-best third-baseman by auction value earned? It was clear that he was going to steal bases, and in the end, that’s what drove his value. If you look at any one of his 15-game rolling charts not involving base running, it would tell you a story of a 22-year-old rookie who has a lot of potential but may not have lit the world on fire in his first year. It happens.

Witt outperformed all of his roto-category projections except for his batting average. He was projected to hit .257 and he hit .254. Not bad, steamer projections. Compared to his 2021 AAA stats, his line-drive rate was down and his ground ball rate was up. He also put out fewer fly-balls for home runs than he did in AAA. However, he still showed that he has the 22-year-old ability to absolutely smoke the ball with his 92nd Statcast percentile maxEV. But, he had a difficult time with major league four-seamers, putting up a -7 Statcast run value and a 23rd worst (among qualified hitters) -2.6 pitch-info p-val on wFA. However, Witt accumulated 632 plate appearances in his rookie season (second behind Steven Kwan) and that experience must be worth a few extra dollars going into 2023.

Bobby Witt Jr. 2022 Value
Value POS PA mAVG mRBI mR mSB mHR Dollars
Steamer Projected 3B/SS 558 -$0.70 -$0.88 -$1.42 $3.80 -$0.80 $8.53
YTD 3B/SS 632 -$1.04 $1.85 $2.11 $7.46 $0.27 $20.67
*Steamer Projections

Finalist #2: Daulton Varsho, Projected negative: mAVG, mHR, mRBI, mR. Earned positive: mHR, mRBI, mR, mSB

One thing to keep in mind is Varsho’s increased projected value due to his eligibility at catcher. The positional scarcity earns him a higher value. But, Varsho was a catcher-eligible player who was expected to run and he did not disappoint, stealing a career-high (MLB) 16 bases. He also put together a close-to-full season with 592 plate appearances in 151 games. He was a workhorse this season and everything but his batting average (.234) showed it.

Daulton Varsho 2022 Value
Value PA mAVG mRBI mR mSB mHR Dollars
Steamer Projected 492 -$1.02 -$2.16 -$2.83 $0.37 -$1.55 $18.86
YTD 592 -$3.20 $0.96 $1.63 $2.62 $2.53 $23.32
*Steamer Projections

However, these roto-value gains don’t seem to be accompanied by much underlying Statcast data:

Varsho Statcast

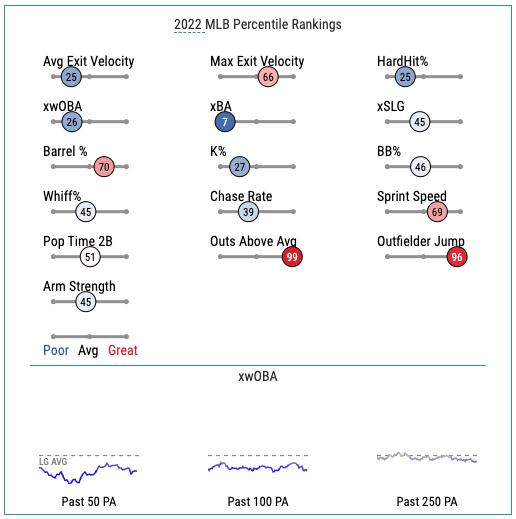
He did catch 31 games in 2022, so depending on your league rules, he may or may not be eligible again at the catcher position in 2023. Regardless, no matter which way you look at it, 27 home runs and 16 stolen bases at the catcher position in 2022 play nicely on any fantasy team under any league parameters. For a player who has only had roughly one and a half seasons at the major league level, I’m looking forward to seeing his 2023 projections.

…and the award goes to…

Finalist #3: Dansby Swanson, Projected negative: mAVG, mHR, mRBI, mR. Earned positive: mHR, mRBI, mR, mSB, mAVG

As Swanson heads into free agency this offseason, his 2022 totals indicate that he intended to make a statement.  In 2022 he put up the most plate appearances of his career, scored the most runs, hit the most RBI, and stole the most bases. He also put up his lowest BB%, which didn’t help those rostering him in OBP leagues. His K% has been on an upward trend in the past three seasons, but so have his home run totals, FB% and SwStr%. Swanson K%

Swanson FB%, SwStr%

Is he selling out for power? Maybe. But he also outperformed his batting average projection (steamer) of .245 by over 20 points (.277) and the 2022 major league average was .243.

Don’t call him a rabbit, but he did run, stealing a career-high 18 bags. However, he’s not being given this award because he stole bases, he’s being given this prestigious award because he did everything else.

Dansby Swanson 2022 Value
Name POS PA mAVG mRBI mR mSB mHR Dollars
Steamer Projected SS 601 -$2.97 -$0.84 -$0.94 -$0.34 -$1.63 $3.07
YTD SS 696 $2.24 $4.25 $4.83 $3.31 $1.88 $26.54
*Steamer Projections

Congratulations to Dansby Swanson on an amazing season and to any fantasy managers that rostered him. Next week, I’ll begin my dishing out these highly coveted awards to pitchers.


Hitter Auction Calculator Awards: Nobody Saw You Comin’ Award

To qualify for this totally made-up award, a player must have earned positive value by the season’s end (2022) and show the largest difference in projected value versus end-of-season value. Simply put, I subtracted earned value from projected value, called it ‘Diff’, and sorted descending. It should be noted ahead of time that these three players were negatively valued due to very low plate appearance projections.

Finalists: Jon Berti, Brendan Donovan, Brandon Drury

Finalist #1: Jon Berti, Projected: $-27, Earned: $6

PA projection average: 183, 2022 PA: 404

In his age-32 season, Jon Berti stole 41 bases. He did it in 404 plate appearances. The next four hitters with the most stolen bases in at least 400 plate appearances (Jorge Mateo, Cedric Mullins, Tommy Edman, and Randy Arozarena) averaged 620 plate appearances. Berti swiped the most bags in the majors this season and did it in significantly fewer PA’s than his competition. He was only caught stealing five times. Unfortunately, Berti’s value was driven solely by base-stealing production. Though he finished the year with a .240 average (MLB: .243) and a .324 OBP (MLB: .312), his four home runs squashed his run production. He finished the year with only 47 runs and 28 RBI. If you go to the Auction Calculator and sort by mSB, you’ll find that Jon Berti is the first on the list, but that the next 16 players all returned more overall value. Regardless, a $33 difference in what was projected and what was earned means that if you paid $1 for Berti, you made a profit and that’s really what it’s all about, isn’t it?

Jon Berti 2022 Value
Value POS PA mAVG mRBI mR mSB mHR Dollars
Steamer Projected 2B/3B 118 -$0.81 -$12.28 -$12.32 -$1.64 -$8.82 -$26.98
YTD 2B/3B 404 -$1.76 -$5.94 -$3.49 $11.26 -$4.90 $5.67
*Steamer Projections

Finalist #2: Brendan Donovan, Projected: $-32, Earned: $3

PA projection average: 19, 2022 PA: 468

Check Donovan’s FanGraphs blogroll and you’ll see that he’s been written about thoroughly in the past few months. Eric Longenhagen’s July 1st ranking of Donovan placed him 7th in the organization and he really nailed this bit:

“Donovan grinds out great at-bats, he is tough to make chase and even more difficult to beat within the strike zone”

Donovan’s profile and prospect write-ups may eliminate him from the “Nobody Saw Him Comin'” qualifications, but I certainly did not see/hear anyone touting him prior to the 2022 season. Like Berti, Donovan was limited to one single category when it comes to returning a positive value, but he certainly helped fantasy managers playing in OBP leagues who rostered him. Among hitters with at least 450 PA’s in 2022, Donovan placed 7th in OBP with .394, finishing right behind Juan Soto who finished the year at .401. He did so with an excellent 12.8% BB%, well above the league average 8.2%. One more great quality of Donovan’s in 2022 was his ability to play all over the field. Here’s a count of his games played at each position from his player page:

2022 Games Played:

2B: 38    3B: 31    RF: 20    LF: 19    1B: 16    DH: 16    SS: 7

While Donovan’s year was a success from a player standpoint, it would be hard to consider him a full roto fantasy asset in 2023.

Brendan Donovan 2022 Value
Value PA mAVG mRBI mR mSB mHR Dollars
Steamer Projected 20 -$0.02 -$13.91 -$14.35 -$3.17 -$9.51 -$32.01
YTD 468 $1.80 -$3.39 -$0.77 -$2.22 -$4.58 $2.51
*Steamer Projections

…and the award goes to…

Finalist #3: Brandon Drury, Projected: $-31, Earned: $17

PA projection average: 56, 2022 PA: 568

Brandon Drury 2022 Value
Name POS PA mAVG mRBI mR mSB mHR Dollars
Steamer Projected P/1B/2B/3B/OF 38 -$0.23 -$13.44 -$13.95 -$3.23 -$9.17 -$31.13
YTD 1B/2B/3B/DH 568 $0.13 $2.90 $2.91 -$2.22 $2.85 $17.09
*Steamer Projections

Drury cooled off some between the first half (133 wRC+) and the second half (107 wRC+), but stayed above average to end the season (123 wRC+). During the trade deadline, Luke Hooper detailed Drury’s improved batted ball skills, including an increased barrel rate coupled with a career-low swinging strike rate. But realistically, Drury finally found consistent playing time. His 568 plate appearances beat his career high of 499 back in 2016 and blew his 2020 49 PA’s and 2021 88 PA’s out of the water. But Drury also tapped into some pull power in 2022, pulling 22 of his 28 home runs over the fence. Yet it would seem like an easy route to take to boil Drury’s production down to simply increased pull power. Yes, his batting average on pulled balls was .385, good for a 237 wRC+, but he also showcased above-average (SLG .457) production on opposite-field batted balls at .523, most of which came off of line drives:

Drury Batted Ball Rolling Chart

Finally, like Donovan, Drury played all over the field and gave fantasy managers flexibility:

2022 Games Played:

3B: 67 1B: 30 2B: 27 DH: 26 SS: 2 RF:1

In truth, it’s hard to look at Drury’s 2022 stats and notice huge sweeping changes beyond the steady accumulation of PAs. Sometimes, players get opportunities and make the most of them.

Congratulations to Brandon Drury on an amazing season and to any fantasy managers that rostered him. Next week, I’ll take a look at the overall largest differences in projections versus earned value with the Don’t Call Me a Rabbit Award.


Hitter Auction Calculator Awards: The Exceeds Expectations Award

To qualify for this totally made-up award, a player must have earned at least $5 by the end of the season and accumulated at least $5 more than expected. This query logic allows for players who we already knew would be good, but we just didn’t know would be this good.

Finalists: Aaron Judge, Paul Goldschmidt, and Freddie Freeman

Finalist #1: Paul Goldschmidt, Projected: $19, Earned: $34

The man has never really been bad, but if you had faded him in your rankings headed into his age 35 season due to some of the dips witnessed in 2o21, it’s likely that no one gave you a hard time.

Goldschmidt Rolling wOBA

If you didn’t fade, you came out with a player who exceeded his z-scores in every single category excluding stolen bases, but even his stolen base value was nearly average with 7 on the year. Here’s a look at his projected and earned value:

Paul Goldschmidt 2022 Value
Value POS ADP PA mAVG mRBI mR mSB mHR Dollars
Steamer Projected 1B 47.6 675 $2.78 $2.35 $3.76 -$0.30 $2.16 $18.77
Steamer YTD 1B/DH 47.6 651 $7.35 $7.29 $6.02 -$0.48 $5.17 $33.79
*Steamer Projections

Goldschmidt has very little in his skills profile that would indicate an age decline. There is hardly anything that has gone through significant change or deviation from his career averages. Simply put, he has been one of the most steady and productive fantasy players in history and if you had him on your team, you were likely one of the top teams in your league.

Finalist #2: Freddie Freeman, Projected: $26, Earned: $33

Freeman was the 12th most valuable player listed on the preseason auction calculator (steamer, default settings) and the fourth best player with 2022 YTD settings. It should not be a surprise that he finished as a top-five hitter, but if you got Freeman and you didn’t overpay, you generated some good value. There was very little time this season that Freeman’s 15-game rolling wRC+ was below 100.

Freeman Rolling wRC+

Freeman outperformed his z-scores in every category except for home runs. He was projected for 32 and he only hit 21. While his HR/FB rate may indicate that he was unlucky, his HardHit% declined this season and has been declining over the span of the last four seasons. Freeman ended the year with a 12% HR/FB while the league averaged 11.4%:

Freeman HR/FB and HardHit%

Freddie Freeman 2022 Value
Value ADP PA mAVG mRBI mR mSB mHR Dollars
Steamer Projected 17.9 675 $6.24 $3.77 $5.84 -$0.56 $2.66 $25.97
Steamer YTD 17.9 704 $8.69 $4.68 $7.62 $1.61 $0.30 $31.33
*Steamer Projections

…and the award goes to…

Finalist #3: Aaron Judge, Projected: $27, Earned: $55

Aaron Judge 2022 Value
Value ADP PA mAVG mRBI mR mSB mHR Dollars
Steamer Projected 35.4 665 $2.43 $5.53 $4.89 -$0.94 $6.17 $27.03
Steamer YTD 35.4 696 $6.56 $9.74 $10.34 $2.65 $13.95 $54.86
*Steamer Projections

Are you surprised? Judge was slept on this season. I write that knowing his ADP was in the third round, but I think many fantasy managers were hesitant due to his injury history. Sure, Judge outperformed all of our projection systems’ home run totals by over 20, but did you see those 16 stolen bases?! This was one of the most dominant fantasy seasons by a single player in a long time. The only player to come close to his end-of-season $55 value was Miguel Cabrera’s 2014 $44.8 and Mookie Betts‘ 2018 $44.0. That’s just what happens when you break the American League (AL) single-season home run record and make a push for the AL triple crown. It is truly remarkable what Aaron Judge did this season from a fantasy perspective. To think that he could have been a 20-20 player with only four more steals is somewhat mind-boggling. Anyone who rostered Judge was taking a risk. Here’s a look at his “Five-Year Injury Log” courtesy of Ron Schandler’s 2022 Baseball Forecaster:

18 – 50 days, right wrist fracture

19 – 62 days strained L oblique

20 – 34 days strained R calf

21 – 12 days COVID-19

Fantasy managers who realized the potential in a healthy Aaron Judge season likely gambled and took him early. If you saw his $27 pre-season projected value and thought, “No, that can’t be right”, and you tacked on an additional $20, you would have still underpaid by $8. Simply amazing.

Congratulation to Aaron Judge on an amazing season and to any fantasy managers that rostered him. Next week, I’ll take a look at the overall largest differences in projections versus earned value with the Nobody Saw You Comin’ Award.


Baseballs to the Moon!

I won’t claim to know as much about Bitcoin as some of my peers, but I know enough to determine that winning $100K of it would be great. For the more crypto-skeptical baseball fans out there, MLB and their new contest sponsor, FTX, are offering cold, hard cash as an alternative reward for their new promo contest. The challenge? Guess who will hit the longest home run of the rest of the season, the distance in feet of that home run, and the type of home run (solo, 2-run, etc.,). Let’s take a look at the details of the Moon Blast contest and see if our more enlightened way of thinking can help make a prediction.

Read the rest of this entry »


Roto Riteup: July 31, 2020

I feel personally attacked by this poll:

Read the rest of this entry »


Reviewing the 2016 RotoGraphs Staff Picks

I’m needlessly competitive. I’ll manufacture any kind of pathetic excuse to turn literally anything into a contest, especially if there’s a moderately easy way to tally stats for it. So, let’s review the RotoGraphs staff’s picks for the 2016 season.

We make picks every season, but as I took up curating them last season, I wanted to hold us accountable while also simply seeing how well we did. Hindsight-spoiler: we actually did pretty poorly. Having not yet evaluated the results whatsoever, I hope for better but secretly anticipate more of the same.

The rules: are dumb and contrived. You’re welcome! Anyway, I choose a winner for each category based on, yes, stats, but also the uniqueness of the pick. For example, picking Noah Syndergaard as 2016’s best sophomore pitcher wasn’t exactly groundbreaking.

Again, this is mostly for fun, but it’s also worth rewarding, with the weakest of praise, those who excelled with their picks. As a reminder, I describe the criteria for each category in the original post. With that said, let’s needlessly compete!

Read the rest of this entry »


The Change: 2016’s Top 20 Fantasy Players

We’ve done a good thing for those of you that still care about fantasy baseball right now. The Auction Calculator now has 2016 stats as an option so that you can look backwards at what has just happened. That’s going to be part of our effort, on the way to the end of the year, to look at last year to learn more for next year.

This is an important part of fantasy that usually gets ignored. Not only does the league itself change year to year, so retrospection is important in that way, but we can learn things about fantasy itself that will improve our ability to value players going forward.

The fourth-best player in the game last year, by this list, has already inspired a possible change to the auction calculator going forward. Let’s see what else it jars loose.

Read the rest of this entry »


The 2016 xStats Most Improved Batters

Last week I wrote about this season’s top pitchers and batters according to xStats. The top players in each category weren’t especially controversial, Clayton Kershaw, Aroldis Chapman, and Mike Trout respectively for Starting Pitcher, Reliever, and Batter. You could perhaps debate Chapman, maybe you prefer Andrew Miller for instance, but generally these guys are universally regarded as the top in the game. This week I want to look at the most improved players. I am using the same weighted rank I used last week. It isn’t any sort of sophisticated weighting, it is more of a back of the envelope type estimation for how each of the associated stats relate to run scoring. I’m just giving xOBA and VH% 40% of the weight, xSLG, xBACON, and xOBP share the next 40%, and PH%, xAVG, and xBABIP share the remaining 20%. I feel this roughly represents each of their predictive power, relative to one another, but is gut feeling, these rankings are very subjective.

I’ve taken the 15 most improved batters from 2015 with at least 400 PA using according to the ranking I described above. Batters had to have as least 400 PA in both 2015 and 2016 in order to qualify.


Most Improved Batters In 2016
2015 2016 Rank
Name PA xBABIP xOBA VH% PH% Rank PA xBABIP xOBA VH% PH% Rank Increase
Jean Segura 584 .310 .288 4.5% 21.1% 151 687 .325 .363 8.9% 16.9% 20 131
Jose Altuve 689 .295 .323 5.7% 26.7% 134 716 .313 .385 9.5% 22.9% 25 109
Yasmany Tomas 426 .337 .290 5.4% 14.3% 127 563 .310 .365 10.7% 16.7% 16 111
Gregory Polanco 654 .303 .315 5.5% 20.8% 133 588 .325 .354 9.2% 16.7% 31 102
Addison Russell 525 .277 .276 5.7% 22.3% 165 590 .286 .342 7.8% 19.3% 83 82
Charlie Blackmon 685 .306 .323 5.8% 21.9% 121 632 .315 .366 9.0% 19.9% 28 93
Wilson Ramos 503 .303 .319 6.4% 20.3% 111 522 .308 .373 10.0% 19.2% 18 93
Neil Walker 603 .278 .313 5.3% 24.1% 155 458 .272 .359 8.7% 24.9% 73 82
Ian Desmond 640 .290 .289 7.0% 18.4% 142 674 .325 .335 7.9% 15.9% 58 84
Chris Carter 459 .242 .322 8.3% 19.2% 125 637 .273 .360 11.0% 17.1% 38 87
Yadier Molina 528 .301 .314 5.3% 27.1% 143 579 .322 .353 6.9% 21.2% 61 82
Victor Martinez 485 .285 .337 6.8% 27.0% 116 608 .306 .370 8.2% 19.7% 34 82
Mike Napoli 469 .237 .311 6.6% 22.6% 153 641 .248 .344 9.5% 19.7% 81 72
Daniel Murphy 538 .298 .353 8.6% 27.0% 70 579 .311 .401 10.4% 19.3% 7 63
DJ LeMahieu 622 .348 .332 5.5% 13.3% 69 634 .383 .394 7.6% 12.3% 10 59
SOURCE: xstats.org
Min 400PA, Ranks determined by a weighted ranking of xAVG, xOBP, xSLG, xBABIP, xBACON, xOBA, VH%, and PH%, putting emphasis on xOBA and VH%.

Read the rest of this entry »


Roto Riteup: May 6, 2016

I wish I could give each and every one of you one of these. Happy Friday.


Read the rest of this entry »


2015 Roto Rookie Hitter

You don’t need me to tell you that 2015 produced an outstanding group of Rookie Hitters. The question is which player rises to the top of this very stellar group?

In order to make this determination, we first needed to select  criteria upon which to assess offensive performance. In my opinion, RC+ is a great tool because it is easy to use.  Any two players can be compared because it establishes a league average rate for position players of 100. It also controls for league and park effects but does not control for position played which will enter the conversation latter. Since we are talking about hitting only, we are not factoring in the defensive wizardry or lack thereof of any of the players selected.

Read the rest of this entry »