New Everyday Players — Sep 13, 2023
September 13, 2023
Long time no see, eh? There’s never a day without at least a pair of new everyday players to report on!
Long time no see, eh? There’s never a day without at least a pair of new everyday players to report on!
It’s another edition of our dive into new everyday players!
With only three more weeks to go of the regular season, playing time remains king for fantasy owners. You can’t afford to be losing out on at-bats, so paying attention to playing time situations is extremely important. Let’s discuss three guys finding themselves as new everyday players.

The final month of fantasy baseball, for those contending, should be about accumulation in small samples. If you need stats now, you have to go and find them. Yes, I’m talking about hot streaks. Many of you don’t believe in them and that’s fine. Some of you have tried to ride hot streaks in the past and have been burned. But, when you and the person holding down first place are neck and neck in a few offensive category races, you may have no choice but to continue accumulating by changing out your roster spots or at least filling spots when your main guys get an off day. Here are five players who may be available and are on wOBA hot streaks:
–

Walker has been the DH or RF in the Cardinals’ last six games. He has gone 16 for 30 in his last eight games, creating an insane .533/.545/1.033 slash line for himself. Yes, Walker has been incredibly streaky this season, but he’s 21 years old and the Cardinals may just keep rolling him out in RF despite a -17.9 Def mark on the season. A projected 0% chance of making the playoffs makes the Cardinals even more likely to keep Walker in the lineup. Walker is only rostered in 33.5% of ESPN leagues.
The 24-year-old rookie has only played in 19 games, but he has a .381/.500/.810 slash line with six home runs and a stolen base. Beware! His BABIP is .500 and the only time he ever hit above .300 was in 2019 rookie ball. Even more of a warning sign is his 26.9% K%. Need yet another statistic to showcase how flukey this is? Look no further than the difference between his .381 batting average and his .273 statcast expected batting average. The only question is how long will this streak continue? I would pick him up if he’s available and sit him the day after he puts up a oh’fer.
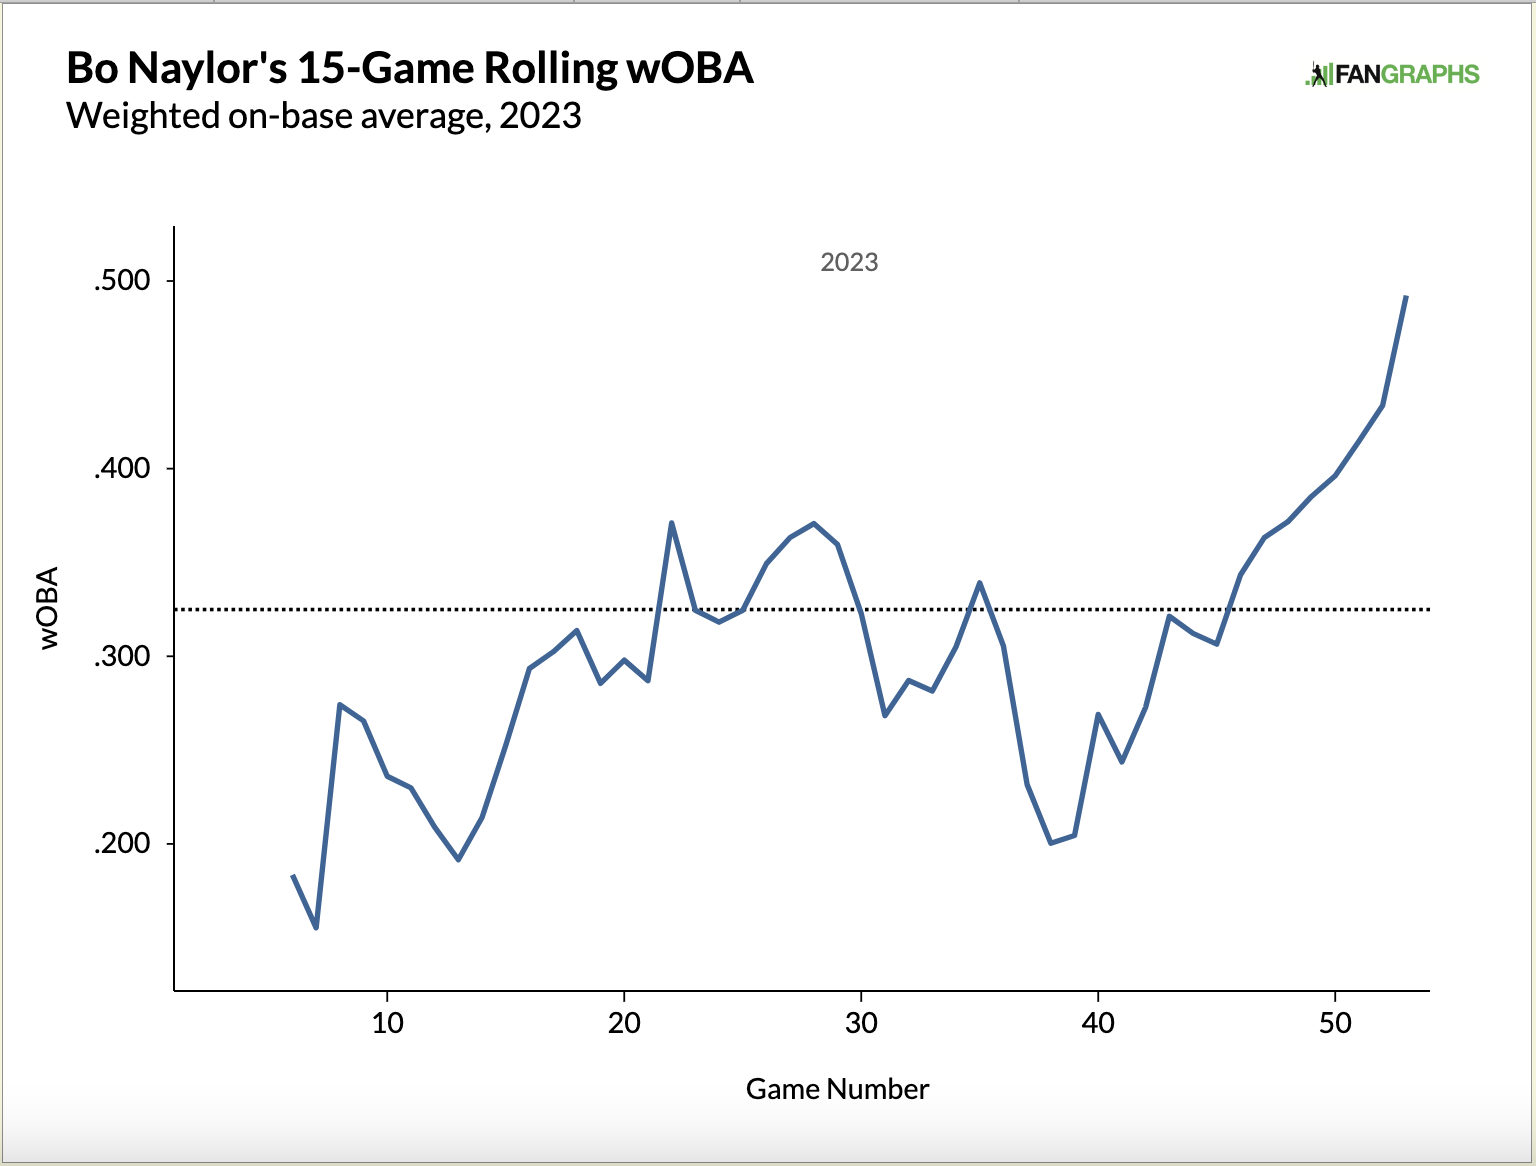
Naylor has hit eighth and started as the Guardians’ catcher in three of his last four starts. He hit in the nine spot in the other start. Naylor does get consistent days off as a catcher, but he’s playing well above his average currently from a wOBA perspective. In his last eight games, he has gone seven for 21 with a slash line of .333/.444/.857 and two stolen bases.
Stephenson is riding a five-game hit streak that has his slash line sitting at .533/.588/.867. That is far better than his season-long slash line of .256/.335/.388, but when you’re hot, you’re hot. He has dipped above the average line once before this season:
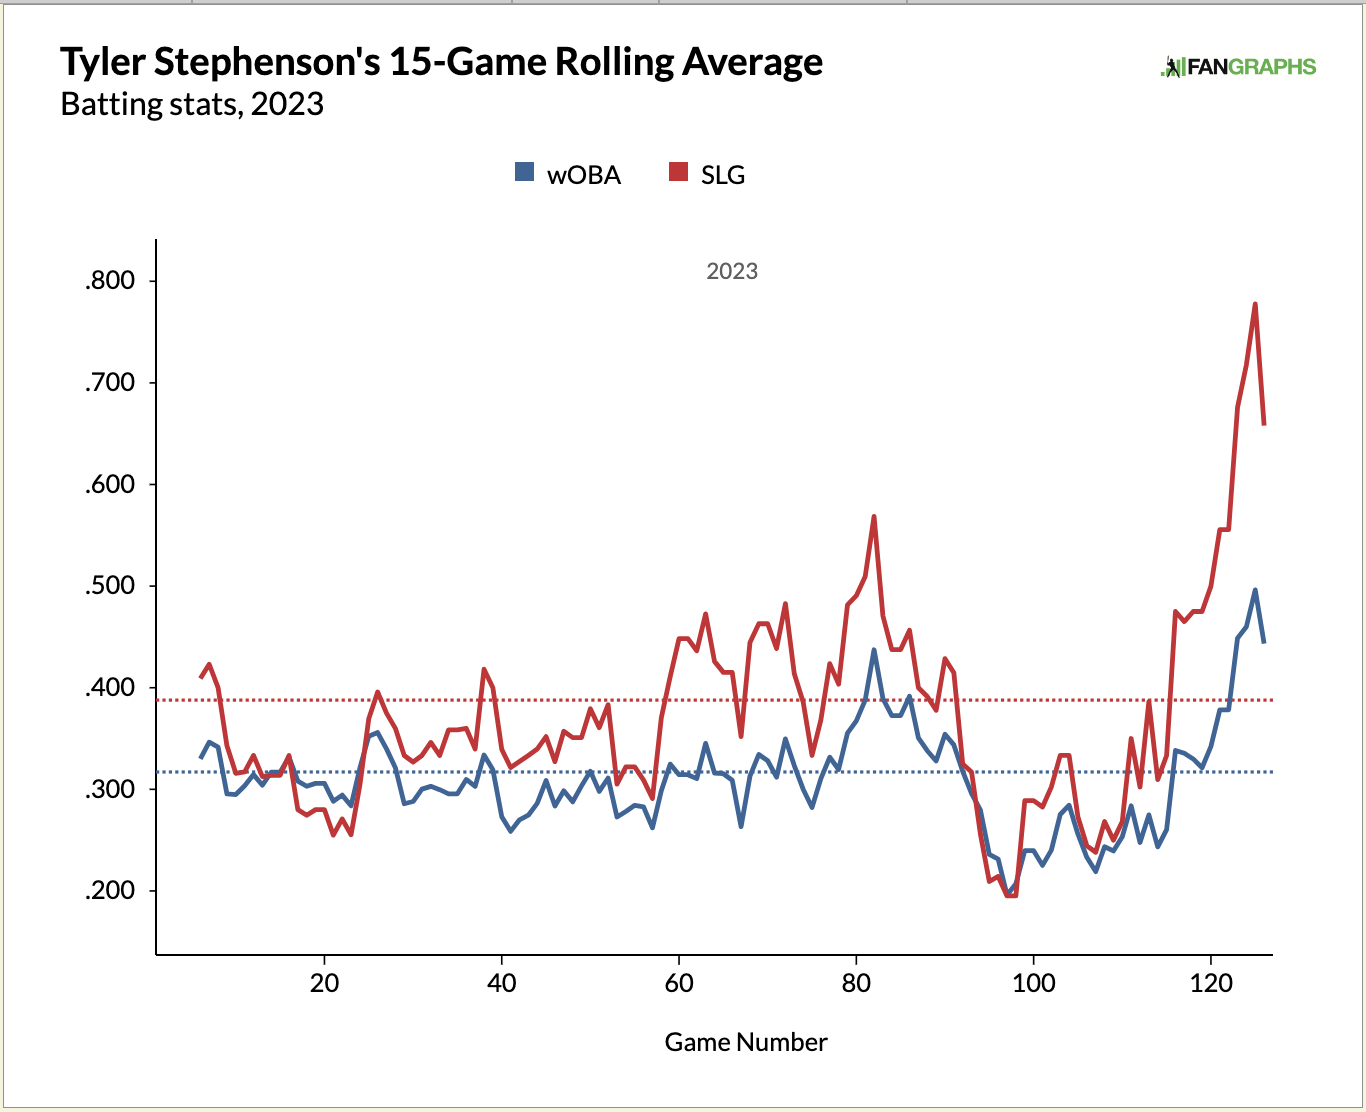
Stephenson has mostly been batting in the seventh spot in a potent Reds lineup, but he gets regular days off being a catcher. If you have catcher spots to fill in your lineup, consider adding Stephenson while he’s mashing. Just pay close attention to pick up on when he starts cooling off.
What’s up with all these catchers boosting in wOBA in the last two weeks? Garver joins the list and is doing a lot of it from the DH spot. Beware, on September 6th (last night as of this writing), Garver went 0-4. Does that indicate the hot streak is over? Who knows? Prior to last night’s oh’fer, the 32-year-old righty had gone 14 for 40 making a .350/.480/.875 slash line and recording seven home runs. Despite injury issues, Garver has put together a strong season in only 66 games, showing a season-long line of .283/.375/.543 and posting 16 home runs, his highest mark since 2019 when he put up 31. Garver could be a really nice boost to your totals if you pick and choose the matchups accordingly. His batting average against lefties (.340) is significantly higher than against righties (.265), yet he has hit all 16 of his 2023 home runs against lefties.
More new everyday players, more new everyday players!
You know the drill, let’s talk some new lineup regulars!
NOTE: The stats for this article were pulled on August 18th. Everything in this article reflects that date.
We’ve all done it. Leaving players in your lineup in unfavorable matchups is something that happens for many reasons. Maybe you had to choose between player A and leaving that spot on your roster empty for the day. “Scared money don’t make money!” you screamed as you clicked Joey Gallo into your lineup. But then, Joey Gallo went 0 for 4 and subtracted four points from your hard-earned point totals on the season.
If you’ve had Gallo hanging out on your roster all season long, he has tagged your team for negative points 39 separate times, bringing your team down by a total of 95 points. Now, if you’ve had Gallo on your team all season long, you should be considering changing that. His season-long points-per-game mark currently sits at 3.82, lower than what most would consider rosterable. But what if all of Gallo’s negative point games were taken away as if they never happened? He would technically be a 9.23 P/G player. That’s wild. Too wild. It would never happen. You would be more than a fantasy baseball player if you could predict every bad game and sit a player on those days. But, is there some edge that can be gained from this in a more practical way? Let’s find out.
A hitter can negatively impact your team by recording at-bats without a hit or a walk or a hit-by-pitch. They can also get caught stealing:
| AB | -1.0 |
| H | 5.6 |
| 2B | 2.9 |
| 3B | 5.7 |
| HR | 9.4 |
| BB | 3.0 |
| HBP | 3.0 |
| SB | 1.9 |
| CS | -2.8 |
So who are the players that don’t look great from a P/G perspective or a total points perspective because they so often have negative point games? Or, perhaps, another way to look at it is, who are the really good players who could be even better with less negative point games? Well, here are the top 10 negative points scorers this season with what their P/G mark would be (Adjusted P/G) had they never recorded negative point games:
Note: In order to keep the P/G mark a little more realistic, I’m going to keep the game totals but zero out the negative games.
| Name | NegPoints | NonNegPoints | FG Points | Games | P/G | Adjusted P/G | P/G Diff |
|---|---|---|---|---|---|---|---|
| Luis García | -211.9 | 870.1 | 658.1 | 150 | 4.4 | 5.8 | 1.4 |
| Javier Báez | -128.6 | 442.2 | 313.6 | 104 | 3.0 | 4.3 | 1.2 |
| Teoscar Hernández | -128.0 | 651.8 | 523.8 | 119 | 4.4 | 5.5 | 1.1 |
| Shea Langeliers | -122.6 | 421.3 | 298.7 | 101 | 3.0 | 4.2 | 1.2 |
| Andrés Giménez | -120.4 | 620.7 | 500.3 | 113 | 4.4 | 5.5 | 1.1 |
| Bobby Witt Jr. | -119.5 | 831.6 | 712.1 | 118 | 6.0 | 7.0 | 1.0 |
| Daulton Varsho | -119.2 | 520.7 | 401.5 | 119 | 3.4 | 4.4 | 1.0 |
| Jeremy Peña | -118.6 | 555.7 | 437.1 | 110 | 4.0 | 5.1 | 1.1 |
| Bryan De La Cruz | -117.8 | 651.0 | 533.2 | 116 | 4.6 | 5.6 | 1.0 |
| Nick Castellanos | -117.0 | 751.7 | 634.7 | 115 | 5.5 | 6.5 | 1.0 |
Some of these players are actually excellent Ottoneu points league players despite their knack for dipping below zero with regularity. No one is questioning rostering Bobby Witt Jr. or this year’s version of Nick Castellanos. The table above attempts to forgive these players for all their negative impacts on our teams by replacing negative values with zero. The table tells us two important things. First, these players need to be managed more strictly than others. Javier Báez is over a P/G better when adjusted and that is the reason he is rostered in over a third of all FanGraphs points leagues while still showcasing such low regular/real P/G marks. Fantasy managers just can’t set him and forget him. Second, the table shows us that a player like Luis García can score both a lot of positive and negative points.
Let’s now attempt an experiment that will help us see if paying that much attention can actually be beneficial to our teams. We’ll use Teoscar Hernández as our subject. You’ll never be able to sit Hernández for every good game and bench him for every bad game. But, what if you could get it right 20% of the time? When I randomly strip out 20% of Hernández’s negative point games, I get the following:
Total Points: 545.6, Games: 112, P/G: 4.87
That’s good. He’s worth about .4 more P/G and a little over 20 more points. But, we’ve also lost the 20% of his negative point games and left the roster spot empty in this situation. We benched him for seven games, 20% of the 35 negative-point games. However, this still assumes that we were totally accurate in choosing the right games to bench. To make this a little more realistic, I’ll also bench a random 10% (8 games) of his positive games (75 total). Here’s a more realistic view of Hernández under those conditions:
Total Points: 474.3, Games: 104, P/G: 4.56
Sadly, we’re worse off with this version of Hernández than if we had just kept him fully in our lineup. Keen observers will notice that we’ve taken 15 games away from our team. Maybe, just maybe, if we bring in a replacement for those 15 games we could do better than a full-time Hernández. You may argue with me about whether or not Adam Frazier is a replacement-level player. That’s fine. But he’s my guy and I’m the one writing the article so nah-nah-nah-nah-boo-boo. The cool part is Frazier actually played in 12 of the games that we benched Hernández for and we’ll just have to be ok with the missing three. Here’s our new version of Hernández. I’ll call him Fraz-nández:
Total Points: 505.1, Games: 119, P/G: 4.24
Dang. The 30.8 points that Adam Frazier scored while Hernández rode the pine did not help us get above the mark that Hernández made on his own, negative points and all. Fraz-nández isn’t cutting it.
Sadly this little experiment has exhausted itself and I’m sitting here wondering why I even started it in the first place. Maybe it sparked some ideas. Maybe it made you realize that you should probably do a better job of managing some of your players. But, maybe you’ll also give benching some of these players a try. And yet, the question of whose negative point games are most predictable does enter into the minds of real gamers and that may just be my next task. Finding out what is most predictive of an individual player scoring negative points could really turn this analysis into strategy. Stay tuned.
Here’s the list of players 11-20 who, like the table above, score a lot of negative points and should be managed with extra precaution:
| Name | NegPoints | NonNegPoints | FG Points | Games | P/G | Adjusted P/G | P/G Diff |
|---|---|---|---|---|---|---|---|
| Anthony Volpe | -116.9 | 569.5 | 452.6 | 118 | 3.8 | 4.8 | 1.0 |
| CJ Abrams | -116.6 | 619.9 | 503.3 | 110 | 4.6 | 5.6 | 1.1 |
| Kyle Schwarber | -116.0 | 720.2 | 604.2 | 117 | 5.2 | 6.2 | 1.0 |
| Trea Turner | -116.0 | 679.5 | 563.5 | 116 | 4.9 | 5.9 | 1.0 |
| Leody Taveras | -115.8 | 563.2 | 447.4 | 105 | 4.3 | 5.4 | 1.1 |
| Jeff McNeil | -113.0 | 574.0 | 461.0 | 116 | 4.0 | 4.9 | 1.0 |
| Keibert Ruiz | -113.0 | 562.2 | 449.2 | 100 | 4.5 | 5.6 | 1.1 |
| Dansby Swanson | -112.1 | 678.4 | 566.3 | 106 | 5.3 | 6.4 | 1.1 |
| Martín Maldonado | -112.0 | 299.5 | 187.5 | 88 | 2.1 | 3.4 | 1.3 |
| Salvador Perez | -112.0 | 606.9 | 494.9 | 108 | 4.6 | 5.6 | 1.0 |
We have passed roster expansion day, which means a slew of rookies have been recalled. That also means a never-ending supply of new everyday players to discuss! Let’s get to it.
But WAIT, there’s more! The new everyday players just keep coming. Maybe one of this trio makes for a perfect fit on your team!