Projections-Fueled Top 30 Pitching Prospects, Midseason 2025 Update
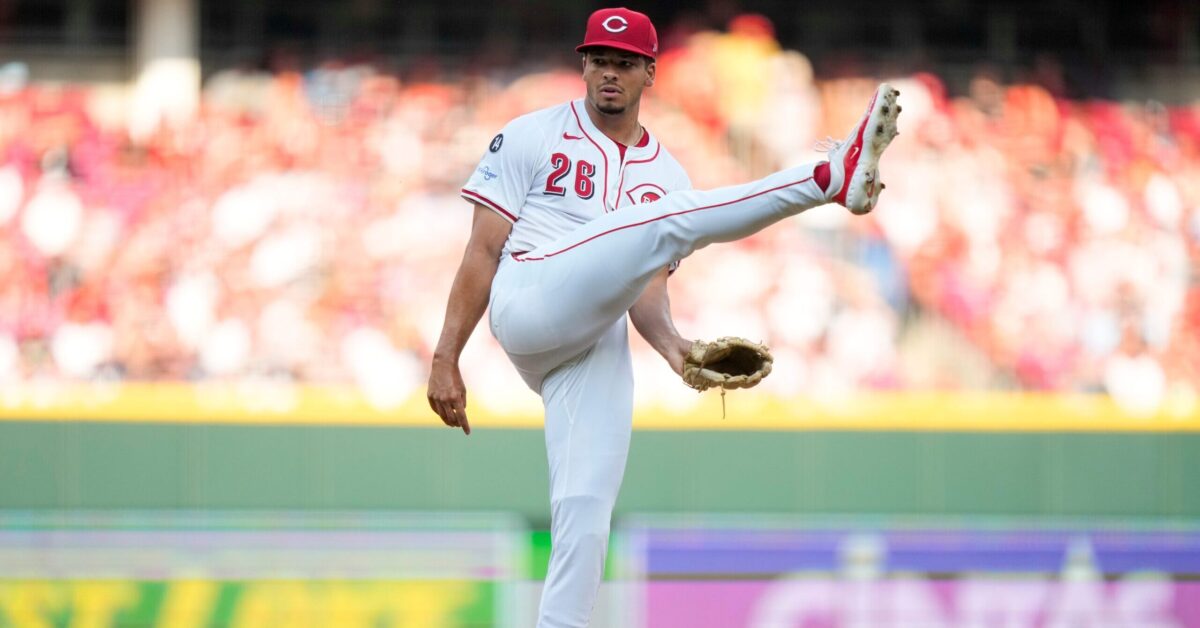
This article takes a look at baseball’s top 30 pitching prospects from a projections-based perspective now that half of the 2025 season is in the books. Jump to the bottom for the updated list!
The projections capture prospect performance across the minor and major leagues in recent years, making use of aging curves, major league equivalencies, league environment adjustments, park factors, and regression to project peak (late-20s) prospect performance. They also capture Stuff+ courtesy of Eno Sarris (only for arms with MLB experience), and, starting this season, velocity (for all minor and major leaguers). They do not capture scouting or amateur performance. For comparison and more methodological detail, you can find the preseason list here, last year’s midseason list here, and an introduction to the projections here.

