Can We Count on Strikeouts From Mike Foltynewicz?
Coming up through the Astros’ minor league system, hard-throwing Mike Foltynewicz was pretty good at getting the swings-and-misses that fantasy owners crave. Yet in his first season with the Astros and his subsequent three seasons with the Braves, Foltynewicz failed to stand out as a swing-and-miss pitcher or as a source of strikeouts.
Through his first 18 starts of 2018, Foltynewicz has fared a little better at getting whiffs and a lot better at getting strikeouts. His swinging strike rate of 10.6 percent is a career high but only 0.6 percentage points better than his previous best in 2016. His strikeout rate of 28.9 percent is more than one-third greater than his 2016 high-water mark of 21.1 percent, and it is the 11th-highest rate among qualified starters this season.
As Mike Podhorzer noted in his research on Auto Out% surgers, it can be hard to buy into Foltynewicz’s improvement as a strikeout pitcher when the gains in his swinging strike rate are so modest. His current rate is just half of a percentage point above the major league average for starting pitchers, so it would be a reasonable assumption that Foltynewicz should only be a slightly above-average strikeout pitcher going forward. The graph below shows the strong relationship that has existed between swinging strike rate and strikeout rate going back to 2016. Within the pool of 433 player seasons consisting of at least 80 innings pitched, the variation in swinging strike rate explains 69.0 percent of the variation in strikeout rate.

There is another possible explanation for Foltynewicz’ notable increase in strikeout rate. He has been much more effective at getting opponents to avoid swinging at pitches in the strike zone so far this season. His Z-Swing% has fallen from 67.2 percent last year to 62.5 percent in 2018. As measured as a called strike rate, he has seen a year-to-year increase from 17.3 to 19.2 percent.
Analysts typically put little focus on called strike rate as a predictor of strikeout rate, and there is some reason for that. As the graph below shows, there is a relationship between called strike rate and strikeout rate, but it’s a weaker relationship. It is also less significant (p = .024), and only explains 1.1 percent of the variation in strikeout rate.

Still, there is some relationship, so it’s worth looking at how much Foltynewicz’s called strike rate might be helping to boost his K-rate. Here is the same scatterplot comparing called strike rate against strikeout rate, but in this one, the marks have been color-coded to denote swinging strike rate. The green marks represent higher rates, and the red marks represent lower rates. Very few pitchers with called strike rates below 16 percent have strikeout rates above 25 percent, but those with called strike rates of at least 19 percent are all over the map. In general, the pitchers who get a lot of freezes also need some help from their swinging strike rate to attain a strikeout rate of at least 25 percent. By and large, the ones who don’t get many whiffs, like Bartolo Colon and Doug Fister, have some of the lowest strikeout rates in the majors, even if they are freezing batters on more than 20 percent of their pitches.
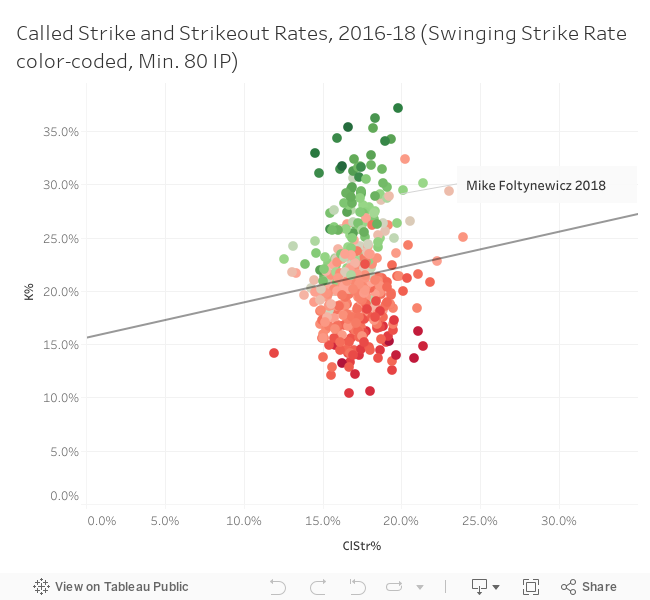
A handful of pitchers, including Foltynewicz, have managed to post strikeout rates of at least 25 percent despite mediocre swinging strike rates. The 2016 seasons of Aaron Nola and Rich Hill are shown by the furthest marks on the right, representing the two highest full-season called strike rates in the sample. Nola registered a 25.1 percent K-rate, while Hill posted a 29.4 percent K-rate, even though both pitchers had swinging strike rates below 11 percent. Neither one provides a good basis of comparison for Foltynewicz, as they were far more successful at getting called strikes than he has been this season.
If we use only pitchers with similar called strike rates — between 19.0 and 20.5 percent — we are limited to a total of six pitchers who also had K-rates of at least 25.0 percent and swinging strike rates below 11.5 percent. Of the other five pitchers, Foltynewicz’s closest comp is Corey Kluber this season. Foltynewicz and Kluber have nearly identical swinging and called strike rates, yet Foltynewicz’s strikeout rate is more than three percentage points higher. Zack Grienke has been a little better than either pitcher in terms of swinging and called strikes, yet he has the lowest strikeout rate of the group.
| Pitcher | Year | K% | SwStrk% | ClStrk% | Foul% |
|---|---|---|---|---|---|
| David Phelps | 2016 | 32.4% | 9.8% | 20.2% | 18.1% |
| Mike Foltynewicz | 2018 | 28.9% | 10.6% | 19.2% | 16.8% |
| Ross Stripling | 2018 | 28.7% | 11.3% | 19.1% | 18.6% |
| Trevor Bauer | 2017 | 26.2% | 9.2% | 19.1% | 16.6% |
| Corey Kluber | 2018 | 25.6% | 10.7% | 19.0% | 17.8% |
| Zack Greinke | 2018 | 25.0% | 11.1% | 19.5% | 15.6% |
To recap, there are only a handful of cases from the last three seasons of pitchers recording strikeout rates in excess of 25 percent without the benefit of a swinging strike rate above 11.5 percent, but a few have been able to clear that K-rate threshold by being good at getting called strikes. Perhaps with a larger sample, we could get a better sense of whether Foltynewicz is doing something sustainable, but the examples we have from Kluber, Greinke and Stripling suggest that some regression is coming.
A post-regression version of Foltynewicz would probably look something like Lance McCullers with slightly less potential for run support. As much genuine improvement as Foltynewicz has made, particularly in his ability to freeze batters, he is probably no Kluber or Greinke, but he could still rank among the top 30 starting pitchers for the remainder of the season.
Al Melchior has been writing about Fantasy baseball and sim games since 2000, and his work has appeared at CBSSports.com, BaseballHQ, Ron Shandler's Baseball Forecaster and FanRagSports. He has also participated in Tout Wars' mixed auction league since 2013. You can follow Al on Twitter @almelchiorbb and find more of his work at almelchior.com.
While the discrepancy between his swinging strikes and called strikes creates some doubt in his second-half prospects, I think it’s also vitally important to consider two other factors: his noticeable shift in pitch usage this season, and the changes in four-seam location.
Up until this year, Folty was a very heavy four-seam/sinker type, and he threw a vast majority of his fastballs on the lower-half of the zone; hitters pummeled him there. Now, he’s throwing (way) more four-seam fastballs belt-high and above, and has cut his sinker usage way down (from 27% in 2017 to 15.1% in 2018).
Furthermore, he’s now throwing his slider – his far and away best pitch from a strikeout/hit-prevention standpoint – as often as he used to throw his sinker, and it’s become a game-changing offering for him. This is what his slider has done in 2018 (all numbers are career highs by a country mile)
– .407 opp. OPS
– 45.8% K rate
– 19.6% Swinging strike rate
– 42.6% O-Swing rate
– 45.4% Zone%
– 13.8 pitch value (4th best in all of baseball, less than 1 point behind Chris Sale’s slider, and only 0.2 points behind Luis Severino’s).
He’s (finally!!!) maximizing the usage of his two best pitches, and has (finally!!!) realized how terrible his sinker was as a primary offering. If anything, I’d like to believe that his slider alone has bolstered his swinging strike rate by itself.