Big Kid Adds: How I Rank Four Starting Pitchers
I started writing this week’s Big Kid Adds, and the article morphed into how to evaluate starters who have thrown just a few games (normal list of added players at the end of the article). With little information to go off besides prospect reports, it’s key to find the best talent before others.
For the four starters, I’ll use a simple FanGraphs query to collect the information I use when there is just a few games worth of data.
The data I collected is to answer the following questions:
- How far did he throw into the game (Pitches and IP)? The key here is to determine if there is enough volume behind the stats to make a difference. It’s not just getting a Win or the Strikeouts, it’s also the added impact the ratios have.
- How hard did he throw (FBv)? I try to target pitchers with at least league-average velocity (93.8 mph).
- How many bats swung and missed (SwStr%)? If the pitcher isn’t missing bats, the hope is that they limit hard contact and that talent won’t be known for at least a couple of years.
- Could he throw strikes (Ball%)? I still believe Ball% is one of the most underrated stats. Some teams won’t promote pitching prospects until they get their Ball% down to an acceptable level.
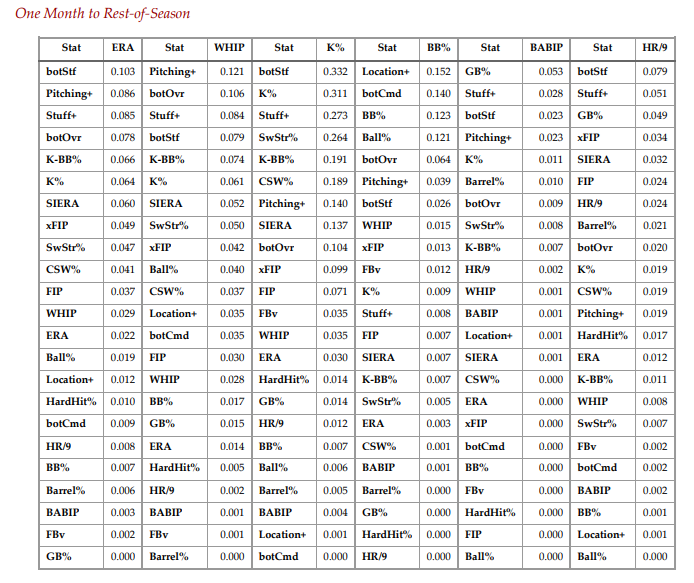
- Do the STUPH models like the pitches (location, stuff, and comment for PitchingBot and Stuff+)? For reference, 50 is PitchingBot’s average. For Stuff+, 100 is average. The STUPH models were created for small samples. A pitch of this shape and velocity performed how? Other factors will eventually work their way into the results, like predictability and tipping, but for a couple of games, look at the STUPH models. In this year’s The Process, I found the following correlations (r-squared from one month to the rest of the season). While I’m not using month’s worth of information, it’s a good reminder of what to focus on (and what not to). The underutilized stats to take advantage of are the Bot values.
Kumar Rocker (10): Rocker recovered from his shoulder injury and started on Wednesday (3 IP, 5 K, 2 BB, 5 ER). He got forced into the rotation because of the injury to Nathan Eovaldi (triceps) and has been demoted.
Here are the stats I focus on with a small data sample.
| Pitches | IP | FBv | SwStr% | Ball% | botStf | botCmd | botOvr | Stuff+ | Location+ | Pitching+ | Balls |
|---|---|---|---|---|---|---|---|---|---|---|---|
| 66 | 3.1 | 97.2 | 19.7% | 31.8% | 42 | 23 | 37 | 103 | 89 | 88 | 21 |
With Rocker, he didn’t go deep into the game but missed a ton of bats (10% Swstr% is a median baseline, 13% is a good pitcher). His 32% Ball is the equivalent of a 2.0 BB/9. Besides the length, the underlying stats point to a solid start.
The STUPH models disagree. In a small sample like this, the models should provide the most insight. Both see Rocker’s performance well below average (37 botStf, 88 Pitching+). I am cautiously optimistic that Rocker can be a usable fantasy option, especially with his fastball jumping 3 mph.
Mick Abel (6): Moving onto Abel (0.79 ERA, 0.71 WHIP, 8.7 K/9), here is how he stands after two starts:
| Pitches | IP | FBv | SwStr% | Ball% | botStf | botCmd | botOvr | Stuff+ | Location+ |
|---|---|---|---|---|---|---|---|---|---|
| 162 | 11.1 | 96.1 | 12.3% | 29.6% | 51 | 67 | 64 | 109 | 108 |
All the stats point to above-average to great for him, except it would be nice to see him average more than 81 pitches per start. This stat line is the one to target and not ask questions. Even if it’s for just a couple more starts, Abel needs to be streamed in all leagues.
Richard Fitts (6): For Fitts, the obvious problem is his inability to find the plate since returning from the IL with a 4.5 BB/9. He’s only been able to complete 4 IP in his two appearances.
| Pitches | IP | FBv | SwStr% | Ball% | botStf | botCmd | botOvr | Stuff+ | Location+ | Pitching+ |
|---|---|---|---|---|---|---|---|---|---|---|
| 83 | 4 | 95.8 | 8.4% | 34.9% | 60 | 44 | 49 | 104 | 86 | 94 |
It’s a mix of good (Stuff, Ball%), and bad (location, SwStr%), and ugly (lack of IP). I don’t see a reason to hold at the moment. He needs to build up his length and hope the rest of his game comes together.
Colton Gordon (6): Gordon seems to have slipped under the radar, but how he performs Friday night (at CLE, Allen) will determine if his demand.
The issue with Gordon so far is that he got hit around in his previous starts (1.8 HR/9, .339 BABIP). Hitters could square him up with his 91 mph fastball. The low velocity is like why the Stuff portions (botstf, Stuff+) of his STUPH grades are low.
| Pitches | IP | FBv | SwStr% | Ball% | botStf | botCmd | botOvr | Stuff+ | Location+ | Pitching+ |
|---|---|---|---|---|---|---|---|---|---|---|
| 328 | 19.2 | 91.1 | 9.1% | 29.0% | 47 | 70 | 63 | 97 | 110 | 100 |
Gordon doesn’t have the most swing-and-miss, but he has great command. I tried to roster him in as many leagues as possible since I knew he wouldn’t cost much.
Conclusion
The previous breakdowns could have been done, or just compare the four with no additional information. Here are the four pitchers combined into one table, ordered by BotOverall and Pitching+.
| Name | Pitches | IP | FBv | SwStr% | Ball% | botStf | botCmd | botOvr | Stuff+ | Location+ | Pitching+ |
|---|---|---|---|---|---|---|---|---|---|---|---|
| Mick Abel | 162 | 11.1 | 96.0 | 12.3% | 29.6% | 51 | 67 | 64 | 109 | 108 | 113 |
| Colton Gordon | 328 | 19.2 | 91.1 | 9.1% | 29.0% | 47 | 70 | 63 | 97 | 110 | 100 |
| Richard Fitts | 83 | 4.0 | 95.8 | 8.4% | 36.1% | 60 | 44 | 49 | 104 | 86 | 94 |
| Kumar Rocker | 66 | 3.1 | 97.8 | 19.7% | 31.8% | 42 | 23 | 37 | 103 | 89 | 88 |
This would be my order of preference when adding them. Abel and Gordon have similar Overall STUPH scores, but Abel throws harder and is already getting more swing-and-miss. Fitts needs to control his pitches, especially since his STUPH grades stand out. While in the past, I might have preferred Rocker, people a lot smarter than me developed the STUPH models, and they agree he’s the worst option.
My goal is to focus on just a few predictive stats when targeting starters with just a game or two. Once the pitches are broken down this way, the best options emerge.
| Name | Leagues Added In | High Winning Bid | Low Winning Bid |
|---|---|---|---|
| Josh Bell | 10 | 52 | 4 |
| Kumar Rocker | 10 | 50 | 2 |
| Jake Mangum | 8 | 53 | 4 |
| Calvin Faucher | 7 | 47 | 3 |
| Alex Vesia | 7 | 32 | 3 |
| Mick Abel | 6 | 53 | 16 |
| Bryce Elder | 6 | 42 | 6 |
| Richard Fitts | 6 | 39 | 22 |
| Thairo Estrada | 6 | 30 | 12 |
| Colton Gordon | 6 | 25 | 11 |
| Jake Fraley | 6 | 13 | 4 |
| Jo Adell | 5 | 41 | 13 |
| Dane Myers | 5 | 26 | 7 |
| Cole Young | 5 | 20 | 8 |
| Kirby Yates | 5 | 13 | 8 |
| Nathan Lukes | 5 | 12 | 6 |
| Cal Quantrill | 5 | 10 | 3 |
| Zack Gelof | 4 | 48 | 2 |
| Landon Knack | 4 | 44 | 3 |
| Denzel Clarke | 4 | 32 | 5 |
| Eduardo Rodriguez | 4 | 22 | 5 |
| Wenceel Perez | 4 | 17 | 2 |
| Jose Quintana | 4 | 16 | 6 |
| Michael Conforto | 4 | 16 | 2 |
| Victor Caratini | 4 | 14 | 2 |
| Alexander Canario | 4 | 10 | 1 |
| Adrian Houser | 4 | 7 | 5 |
| Jeff McNeil | 4 | 6 | 3 |
| Jorge Mateo | 4 | 5 | 2 |
Jeff, one of the authors of the fantasy baseball guide,The Process, writes for RotoGraphs, The Hardball Times, Rotowire, Baseball America, and BaseballHQ. He has been nominated for two SABR Analytics Research Award for Contemporary Analysis and won it in 2013 in tandem with Bill Petti. He has won four FSWA Awards including on for his Mining the News series. He's won Tout Wars three times, LABR twice, and got his first NFBC Main Event win in 2021. Follow him on Twitter @jeffwzimmerman.
Great STUPH, Jeff!
Question for anyone: Where do you find BB% info?
…Ball% info
Just divide Balls by Total Pitches