Beware of Launch Angle
Launch angle continues to trouble me. It might trouble many of you as well, I don’t know. I’ve done a lot of research into which launch angles are the most valuable (10-26), most repeatable (<0 and >26), most common (-10 to 10), and which have the greatest exit velocity (-10 to 20). These are round numbers, and each batter many differ with regards to their personal swing path or pitch selection.
Even with all of this, launch angle troubles me. Especially when I hear people quoting average launch angle.
In a lot of ways, average launch angle might be similar to average pitch velocity. If a pitcher throws 10% breaking balls and 90% fastballs his average velocity would be significantly higher than if he threw 90% breaking balls and 10% fastballs. Alright, 90% breaking balls is extreme, but you get my point. Maybe it is better to look at the velocity of each pitch independently: the guy has a 95mph fastball and an 84 mph curveball. That gives us a lot more information than saying he has an average velocity of, say, 91.
You have the same sort of problem when you quote average launch angle. Is the guy only hitting the ball to extremes? Maybe he only hits ground balls and pop ups, that would give you the same launch angle as a guy who only hit line drives or a guy who hit a perfectly balanced mix of ground balls, line drives, and fly balls. Using the average feels inherently wrong to me, but I haven’t been able to identify a better way to easily sum up this information.
The past few days I’ve been digging through pitch data in hopes of updating my xSwStrk metric from last year. In the process, I’ve been putting together charts to evaluate pitch quality based upon location. I’m a very visual learner, so this is a first step in anything I do. In the process, I’ve noticed a bit of a pattern in exit velocity from which we might be able to draw insight for launch angle.
Below you’ll see a Viz that contains average Exit Velocity, Launch Angle, and xOBA values across the zone. Note that the coordinates are in inches, and this data represents all batted ball data from 2017. I wanted to include 2015 and 2016 data as well, but it kept crashing as I was importing the data. It was unhappy with me for whatever reason. We’ll have to live with 2017 for now.
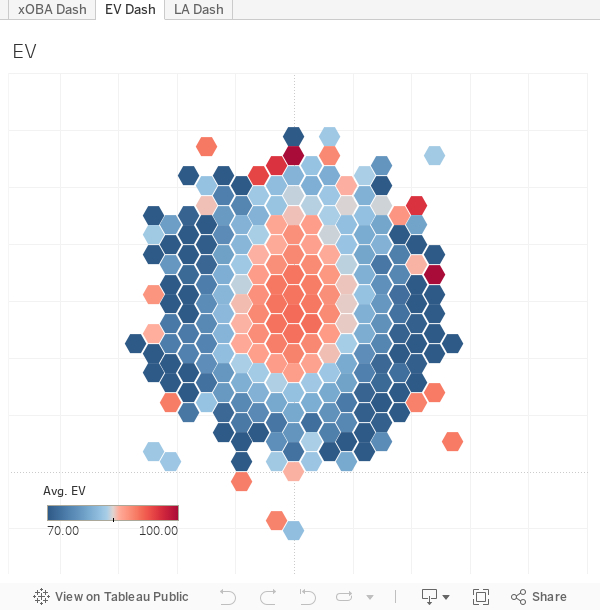
I want you to notice where the highest exit velocity balls are located. They are in the heart of the zone, as you’d expect. It ranges from about 18 inches off the ground up to 40-45 inches. The distribution favors the lower part of this area, which also shouldn’t be a surprise.
All in all, the high exit velocity region represents the area just below the knee up to the belt or maybe belly button area for most batters. This would probably be around the bottom of the rib cage on a guy like Altuve. Just to give some perspective.
It also spans roughly the entire width of the plate, ranging from about -9 to +9 inches, give or take, although it narrows off towards the top of the zone, representing only the middle third of the plate as you get higher above the belt on most batters.
Up to this point, there really should be nothing surprising about this heat map. The middle of the plate between the knee and belt produces good contact. Everyone knows that.
If you look at the xOBA values, not much changes. The zone widens out a bit, with the higher value region covering a few extra inches of the corners when compared to the exit velocity. You can think of these areas as the pulled and pushed line drives down the lines, shallow fly balls that drop for hits, etc. Balls where the batter may not make perfect contact, but can get just enough to get a hit. All things considered, the exit velocity and xOBA values follow a very similar pattern.
Now, look at the launch angle data. I’ve created three color bands for this, two cold blue zones and one hot red zone. The red shows the high value launch angles, and the blue show the extreme angles, which are much lower value, on average.
There is a thick band of high quality launch angles that swoops into the zone, which reaches as low as 28 inches above the ground in the heart of the plate and 30 to 40 inches on the corners. Below this band you see a lot of ground balls, and above this band you see many fly balls.
Okay, so, again, this shouldn’t be a huge surprise. We know that balls low in the zone create more ground balls and those up in the zone tend to create more fly balls. However, the surprising thing, for me, is how disconnected the launch angle values are from the overall values. The overall value is clearly driven by exit velocity to a far greater degree than launch angle. Which, again, shouldn’t be a big surprise. But the degree to which exit velocity wins out over launch angle is very surprising to me.
I fully expected to see a cold area at the bottom of the zone for xOBA, regardless of exit velocity, but that pattern isn’t strong at all. There is a slight gradient in value as you go lower in the zone, but it is overwhelmed by the exit velocity to the point where you can just about ignore launch angle without losing much information at all.
This may be partly the result of exit velocity containing imbedded information about launch angle. As I stated before, exit velocity peaks at certain angles, depending on the specifics of the batter’s swing. That means a ball hit with high exit velocity must be bounded between some minimum and maximum launch angle. For this reason, it is impossible to separate exit velocity from launch angle, they are inherently intertwined.
So, let’s look at an example player: Hunter Renfroe. Renfroe is a young power hitter with the Padres who has a ton of potential. Exciting to watch, I think. But he has very extreme launch angles, he is an extreme fly ball hitter. You might not be able to tell from his 45% fly ball rate, but 19.5% of his balls have been hit above 39 degrees this season. That is tied for 24th (out of 136) among batters with at least 350 plate appearances. He’s also tied for 20th in balls hit above 26 degrees among batters with at least 350 PA. So in either case he is in the top 25 or so in flyball launch angles. Similarly placed batters: Anthony Rendon, Whit Merrifield, Yonder Alonso, and Edwin Encarnacion.
Renfroe has above average exit velocity, sitting around 2 mph above major league average after accounting for park and weather effects. Which, in addition to his above average launch angles should explain his solid home run total.
Alright, with that out of the way, I’ve created very similar exit velocity and launch angle charts for Renfroe.
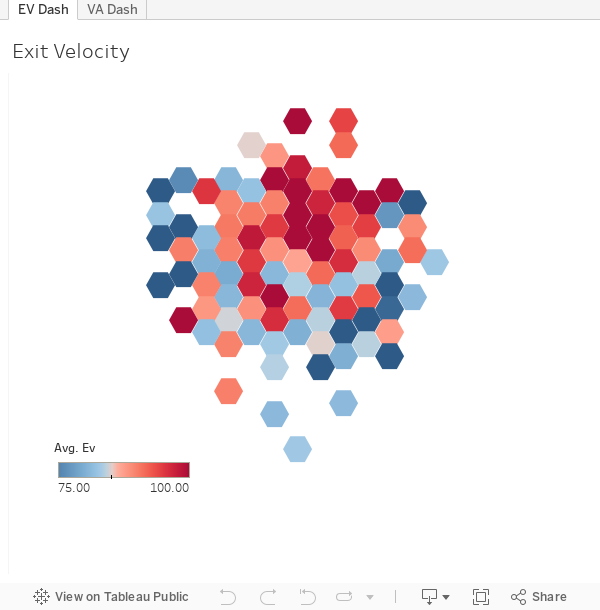
If you hover over the exit velocity chart and look at the coordinates, you should notice that the top of the chart for Renfroe is just about the top of the red blob in the first exit velocity chart I showed. Remember, that one peaked around 40-45 inches, and disregarding the three floating spots, the top of Renfroe’s chart is about 45 inches high.
Renfroe’s high exit velocity region, when you take the prior information into account, matches up just about perfectly with the league average data. All of the areas there he creates high exit velocity just about everyone else in baseball would do the same. Perhaps he has different swing and miss heat maps and things of that nature, but in terms of pure exit velocity he matches up very well.
Now, take a look at his average launch angle data. It is colored slightly differently, this time I made high launch angles purple, low angles blue, and the ideal angles in the middle are red.
The major league average hitters hit balls between 24 and 35 inches above the ground on angles between 10 and 20 degrees. These are extraordinarily valuable launch angles which produce large numbers of doubles and singles and occasionally home runs.
Renfroe hits much of this same region of the strike zone upwards of 25 degrees. A 25 degree ball is very good, but remember these are averages. A ball with an average of 25 degrees likely means many are hit at a much steeper angle, and value drops off extremely quickly once you go above 30 degrees or so. The launch angles increase even more as you move towards his hands on the inside part of the plate, where he is averaging 45-46 degree launch angles.
What does it all mean?
Well, my takeaway is this: exit velocity is easier to wrap your head around. It contains information about launch angle without having to reference the launch angle itself. Batters all seem to produce exit velocities in similar areas of the zone, and exit velocities seem to have pretty similar game values overall.
Launch angle is largely dependent on the particular swing and approach of a given batter. If they have an uppercut, then they will produce high launch angles with their high velocity balls. If they swing down on the ball, then they will have lower launch angles with their high velocity balls.
Launch angle is a very complicated and nuanced topic, and in all likelihood focusing on launch angle will lead you to make ill informed decisions. It might lead you to believe you know something that you do not, cause confusion, or obfuscate the truth.
There are correct and incorrect ways to use launch angle, and they might be subtle. I’m not in any way comfortable using it myself, except to highlight small sample size issues. For example, I know batters will likely have roughly the same number of high launch angle batted balls from one year to another, it is a very sticky stat. So if a batter has much fewer than expected after, say, 100 plate appearances, I feel safe assuming it will balance out over time and return to his career average.
However, if you tell me a batter has increased his angle by a certain amount, I feel like that information is probably sketchy at best. I do not trust it. You would need to tell me more. For example, maybe he changed his swing. Maybe he changed his approach. Those I might believe. But if you quote the angles, no thank you.
Andrew Perpetua is the creator of CitiFieldHR.com and xStats.org, and plays around with Statcast data for fun. Follow him on Twitter @AndrewPerpetua.
I saw the article title and the first thing that came to mind was “Trevor Story.”
Hah, yeah. He came to mind for me, too, but I didn’t want to do yet another Story highlight. Or Alonso. So I sat back and thought who has a high launch angle? Oh, Hunter Renfroe. The dude hits moonshots. He listened to that Watsky song and took it literally.
Swing, out of your shoes
And if you should lose this time
Keep on swinging and swinging and soon
When you connect
With all of your strength
Look up and you might see a dent in the moon
Yeah, you see them craters?
That was ‘cause a kid said there’d be none greater
In ten years Hammering Hank was at the plate launching balls into space saying see ya later