Mining the National League Managers
Michael McLoone-Imagn Images
The following are excerpts from the managers’ press conferences from the Winter Meetings.
Braves
• Ronald Acuña Jr. could lead off again.
Q. I know you haven’t necessarily got to the point of making lineup cards, but he moved down a bit in the order. Do you anticipate [Acuna] moving back up?
WALT WEISS: That’s a good conversation. I’m looking forward to that with him. I want to pick his brain with that. It’s enticing to have him at the top of the order because I’m I really like when a lineup turns over that there’s teeth right away. Your pitcher — you’ve got to run through a gauntlet as soon as that lineup turns over.
So there’s some incentive to — he was prolific in that position. The other argument is, you could put him in a more RBI position in the lineup and hit him third.
Those are conversations we’re going to have, we’re going to talk about. Like you said, we’re a ways away from the lineup, talking about lineups and that type of thing. But it’s on my radar.
• Reynaldo López and Grant Holmes will get a shot at making the rotation.
Q. As healthy as Reynaldo López stayed as a reliever, and then last year, even though two years ago even though he pitched so well, he hasn’t stayed healthy as a starter. Are you tempted to move him back to relief since you have some other guys?
WALT WEISS: Not so much tempted but it’s a nice fallback plan. These guys are going to be built up. I know I get those questions about Grant Holmes and this and that. These guys are going to be built up as starters in Spring Training, but it’s really nice to know that, whatever, because of acquisitions, because of health, whatever, somebody all of a sudden steps up and opens your eyes, it’s nice to know those guys can do that. They’ve done it before and they’ve been really good at it. But sitting here today, those guys are, we’re looking at them as starters.
• Bryce Elder and Hurston Waldrep are being considered for the rotation.
Q. You’ve got some options questions, too, obviously, right, this year complicates some things with a couple of the starters?
WALT WEISS: Yeah, look, Bryce, I was really encouraged by the way Bryce finished. I mean, the stuff ticked up. He was good against some really good teams, playoff teams in September. And he had another run, I think, early, I want to say May, maybe, where he had a nice run. Then he had some hiccups. That’s the thing about Bryce, he’s pretty unflappable. If he has a tough one or a clunker or two, demeanor doesn’t change, confidence doesn’t change, and here he is showing up and posting again and righting the ship. A lot to be said about that.
I’m excited about Bryce. I’m excited about Waldrep. I think the ceiling for Waldrep is pretty high, man. He’s got a wipeout pitch. And it’s hard to find where it’s a legitimate wipeout pitch at the Major League level. He’s got that. There’s some things to be excited about. We talked about Grant already.
Brewers
• No usable fantasy information.
Cardinals
• No usable fantasy information.
Cubs
• Sounds like Moisés Ballesteros will not catch many games.
Q. With Moises, how were you thinking about balancing the need for continued development at the catching position versus his Major League-ready bat?
CRAIG COUNSELL: I think he’s at the point where if he can help the Major League team, he’s going to be in the Major Leagues. There’s not an every day catching job in the Major Leagues for him. But as constructed right now, we’ve got room for at-bats, and I think — I would prioritize the Major Leagues right now. But that can change with roster stuff.
Q. You mentioned Ballesteros not having an opportunity to catch a lot. If the opportunity did pop up, if he was forced into action, how comfortable are you with that?
CRAIG COUNSELL: Yeah, then he’ll catch. Yeah. Simple as that. I think he’s absolutely going to catch games.
Q. Do you feel like he’s made real progress there and you’re comfortable with him as a semi-regular catcher?
CRAIG COUNSELL: Yeah, he’s got to be better than the other two guys. But yeah, I’m comfortable with that.
Diamondbacks
• Lourdes Gurriel Jr. should be back around mid-season.
Q. Do you have any sense on Gurriel with the —
TOREY LOVULLO: The timing?
Q. The window, yes.
TOREY LOVULLO: I haven’t been in touch with him in probably three weeks. I don’t know how he’s doing right now. Last time I talked to him he’s really, really encouraged about how he’s feeling. He’s in a good routine. Timing-wise, I’ve been generically told midseason, something along those lines. Like, head’s up, it could be that long, a little bit longer.
We want to be patient with him, make sure he heals right. He’s in a good space. That’s the most important thing. He’s back in Miami doing his rehab there. He’s in good hands and taking care of himself the best that he possibly can.
Dodgers
• Tommy Edman expects to be healthy to start the season and the injury will not limit the position he plays.
Q. Do you have any more details like Tommy, the timetable for him to be back on the field?
DAVE ROBERTS: Talking to the training staff, feeling like he should be with some limitations once we start Spring Training, but talking to Tommy, he’s expecting to be ready at the outset of the season.
Q. Do you see him as infield/outfield type or is that ankle going to limit him?
DAVE ROBERTS: I don’t think the ankle will limit him. I think that’s going to be contingent more on the roster and where guys are at.
• Tanner Scott was never really healthy last season.
Q. What [is] your confidence in Tanner [Scott]?
DAVE ROBERTS: I think there were just some things he kept under wraps about his body, and I think the transition to LA, and he just kind of — anything that could go wrong went wrong. I just feel — he works his tail off. He’s too talented. And his track record was nothing like last year. So I just think it was an outlier of a season.
Q. [Scott] after he came back after the forearm?
DAVE ROBERTS: There was some stuff that he just, honestly, he never felt right all year. And there were moments where it looked right, he felt okay, but he just never felt comfortable. But he’s never going to use that as an excuse, though. To have a regular offseason to kind of prepare for ’26, he’s going to be on a mission next year.
• Shohei Ohtani will get extra rest but the rest of the rotation will try to remain five-man as much as possible.
Q. You expect Shohei to be used like in a normal rotation starting the season, what ways are you guys going to be creative with him?
DAVE ROBERTS: I think the thought is to have Shohei being used as a regular starter, but it’s not going to be a regular five-man rotation. I just think that — I don’t want to go down the six-man rotation road, but I do feel that giving him six, seven, eight days off to kind of allow him to continue to stay rested and build up, I think that’s in our process. But again we have a long way to go but we’ve got some viable candidates seriously.
• Dalton Rushing will back up Will Smith and maybe play a little first base or DH.
Q. What role do you envision for Dalton Rushing next season? Do you think he could play any other positions possibly?
DAVE ROBERTS: We ran him out there a little bit at first base, but Freddie is a guy that wants to be out there every day. But if there’s an opportunity to get Freddie off his feet, I can see Dalton playing a little bit of first base to spell Freddie.
I also see with Will Smith last year — I think last year you saw — we cut back a little bit on his playing time, and I felt that he stayed strong throughout the entire season. I think there could be some more of that to give Dalton a little bit of runway and some opportunity. I thought he did a great job with the pitching staff. Dalton did. And I think that there’s a lot more bat in there that he’ll show in 2026.
Giants
• What a waste of an interview, not a single question about the players, it was all questions about Vitello and his staff.
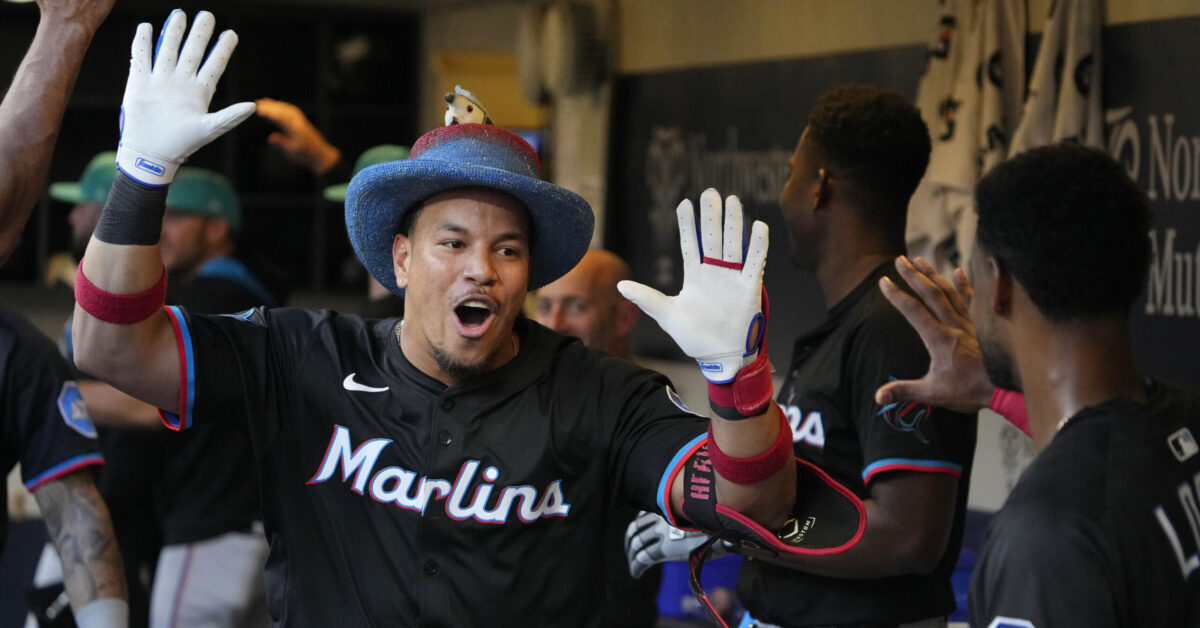
Marlins
• Agustín Ramírez will start the season as the team’s main catcher
Q. [Agustin] and (indiscernible) working the academy, what do you see from him and expectation?
CLAYTON MCCULLOUGH: Our expectation for Gus is he comes in and Gus is going to be a catcher. Still believe in that. Saw Gus for a couple of days down in the Dominican. He was working hard.
And it wasn’t just the work that he was doing. I think speaking with Gus and talking to him, how he was able to reflect on that season. It’s hard to get a breath during the season. So I think Gus had a chance to self-reflect some on the year, take a breath.
One thing that he mentioned physically he felt okay, but mentally, it’s quite the grind. And I asked him to hit in the top of the lineup almost every day. Having to go back there and catch, probably played more than he ever has.
Gus was saying all the right things. He was embracing and taking on this offseason different than he did the last season, which is fair. He has a different perspective on what’s ahead and what’s expected.
Gus knows the narrative. Gus is smart. He knows what’s said and he’s not backing away from it and we’re right behind him because we believe in the person, number one, and believe in the ability that Gus has a real shot to catch the big leagues.
• Some prospects the manager is “looking forward to seeing” are Joe Mack (C), Josh White (RP), Robby Snelling (SP), Thomas White (SP), and (Riley) Kemp Alderman (OF).
Q. What’s the prospect you’re most looking forward to seeing in the Spring Training and why?
CLAYTON MCCULLOUGH: The most exciting part is we have a lot of very talented players in our system coming up. Much has been written about Joe Mack and should be. He’s a young catcher at a premium position that I feel like eventually can impact on both sides of the ball.
I think the year that Josh White had last year in Triple-A from a performance standpoint was spectacular. So excited to get to see Josh more this year. And certainly Robby Snelling, Thomas White, with the type of seasons they have, their youth, the ceiling they have.
Pitching is always going to be what drives this thing. Excited to see them as well, as Kemp Alderman, Minor League Player of the Year. Kemp had a really big year. Our group in Petey loves him. The tenacity, the toughness, the edge he brings, which is something I value as well. Excited to see Kemp get a chance to come to camp and get comfortable around our group.
Mets
• Brett Baty will be the team’s third baseman.
Q. When Semien now occupying second base, how do you view third base? Obviously second base you could use that to get some of the other guys playing time, but now you don’t have that much of a luxury.
CARLOS MENDOZA: I think Brett Baty took that step forward last year. We had tryouts there between Mark Vientos, Brett Baty, Ronny Mauricio at times. I think Brett Baty got comfortable and played really well on both sides of the field, defensively, offensively.
Going into camp, I think as we sit here right now, you can say that Brett will get the majority of the playing time.
That doesn’t mean that Mark Vientos won’t get any reps there. He’s preparing for everything. We know how much he means to the team, and we’ll see what happens. But as of right now, Brett Baty will get a lot of the opportunities.
Nationals
• Nothing fantasy relevant.
Padres
• Nothing fantasy relevant.
Phillies
• Nothing fantasy relevant. All Schwarber talk.
Pirates
• Jhostynxon Garcia could play any outfield position, and the manager seems excited to play him.
Q. You mentioned Garcia. What do you kind of like about just the possibility of him adding some power to the lineup in ’26 and just the impact that he could potentially make?
DON KELLY: Yeah. Some big-time power that he brings and just the ability to play all three outfield positions. Looks like he’s an above average outfielder. Just the way — I saw that double that he hit in his first at-bat down there in winter ball, and the way that he hustled and ran into second. All the reports we’ve gotten back and the video we’ve gotten to watch, we’re really excited to add a young project of his caliber to this team.
Q. Do you think he could handle center if needed?
DON KELLY: I think so. He definitely could go to center field.
• Spencer Horwitz is now the team’s first baseman, nothing more.
Q. We saw Horwitz bounce around a little bit at the end of the year. You guys have been connected to a couple of first basemen. Is second base or another position an option for him, or would you like to keep him at first?
DON KELLY: I think ideally we’d like to keep him at first base. He’s such a good defensive first baseman. But totally open to other ways. We played him at second last year at the end of the season. He’s played second for Toronto.
Just looking at any way to impact the team. Ideally he’ll be at first.
• Sounds like a small chance Joey Bart will get any reps at first base.
Q. With your catchers right now, will you explore another option with Joey Bart? Is first base an option for him to get both bats in the lineup? How do you view the delineation of duties?
DON KELLY: Last year in practice Joey’s taken some ground balls at first. Really see Joey as a catcher, but as it goes, we were able to get him in last year at DH a little at the end. I think that first base, if he continues to take some ground balls, something that we could explore down the line.
• The manager still says they are undecided on Konnor Griffin.
Q. Do you anticipate seeing Konnor in the mix for the shortstop position in Spring Training?
DON KELLY: Konnor’s going to get — yeah, we’re still talking about a lot of that. It’s too early to say exactly what’s going to happen there. But as far as a 19-year-old guy that just came out of high school, the year that he had to go through three levels and play the way that he played, the sky’s the limit for him. The talent that you see, the wiring, the way he goes about it, he’s really, really impressive.
Reds
• Sal Stewart still doesn’t have a place on an MLB team.
Q. How does someone like Sal Stewart fit in your plans? Knowing obviously you have more roster choices coming up, but how do you see him fitting and growing within the month?
TERRY FRANCONA: I think Freddie went down to visit with him for a couple of days in Miami, just to help him defensively at first base. It’s going to be interesting because we love, love the hitter. I remember all the way back last year in Spring Training — I think I told you guys I thought he was one of the most advanced young hitters I’d seen, and I believe that. Rarely do you see guys come to the Big Leagues like that late in the year, and he wasn’t overwhelmed.
Where his game goes defensively, we’re still trying to figure that out. I talked to him at length — it’s been a while now — but about being agile. People talk about his weight. I said, I don’t want to talk about your weight. I want you to be athletic. Because he’s a baseball player. Where that fits, we’ll see.
Rockies
• Blaine Crim was the only person mentioned for the first base job.
Q. A lot of turnover at first base so far this off-season. Where do you kind of see the position? A lot of time still before Spring Training, but where do you see it right now?
WARREN SCHAEFFER: We’ve got Crim coming in to battle for that job. I feel like guys are going to come out here in competition for that spot. Just like a lot of spots in the diamond and the pitching, we’re going to have a lot of competition.
• Hunter Goodman will continue to get DH at-bats.
Q. Following up on that, you did this quite a bit the second half last year. Could [Goodman] be your full-time DH when he’s not behind the plate?
WARREN SCHAEFFER: Yeah, that’s something we’re going to talk about big time, because I personally think that’s a yes, that he can. We pushed him last year at the end. We tried to get him through that knee injury, had a little bit going on there. I think there was something else, hamstring was barking. So we wanted to keep him healthy.
I do believe that he’s got the makeup and the physical toughness and ability and durability to be able to do that. We’ll see where that goes, but I think that’s maybe the initial plan.