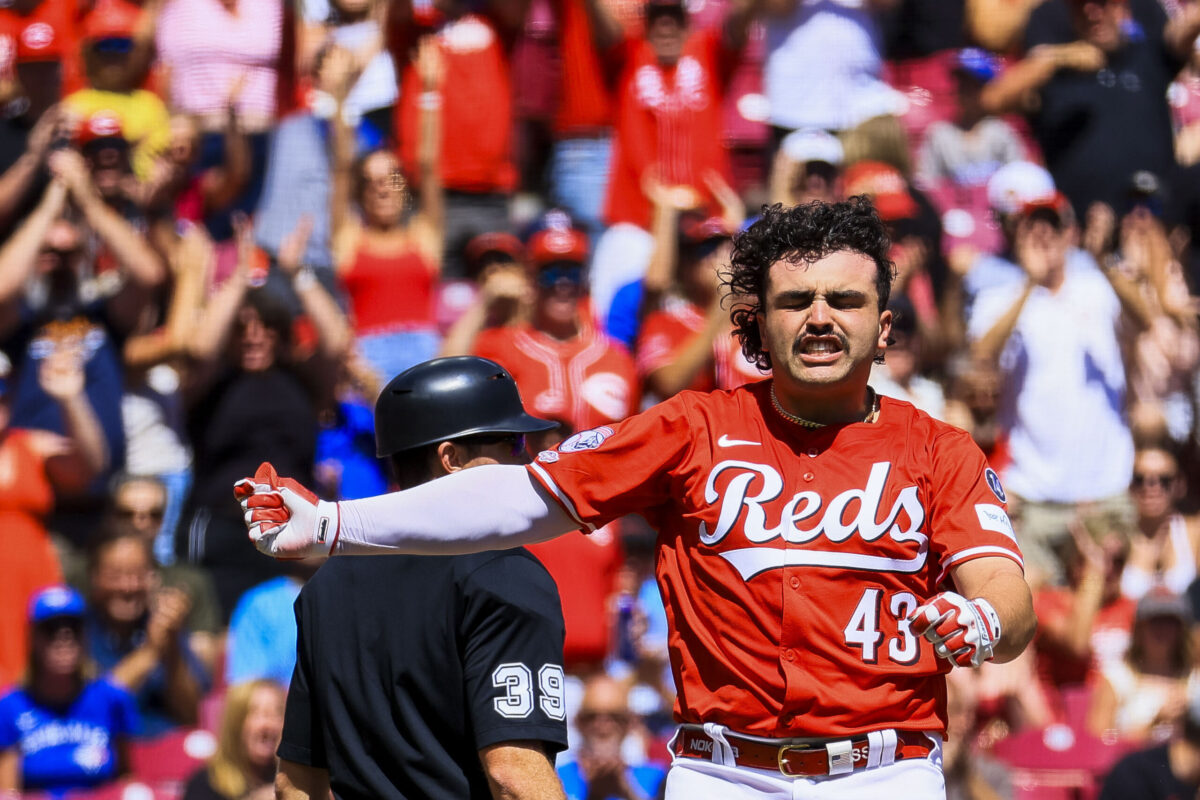
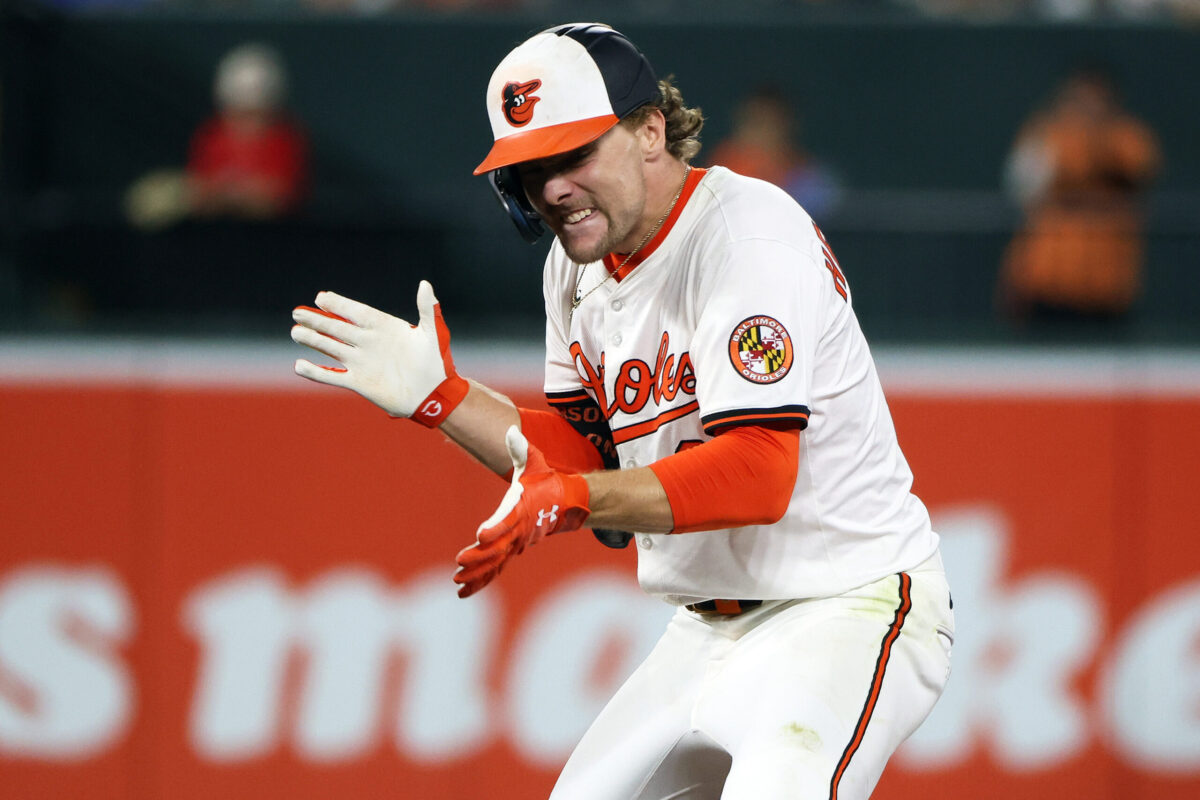
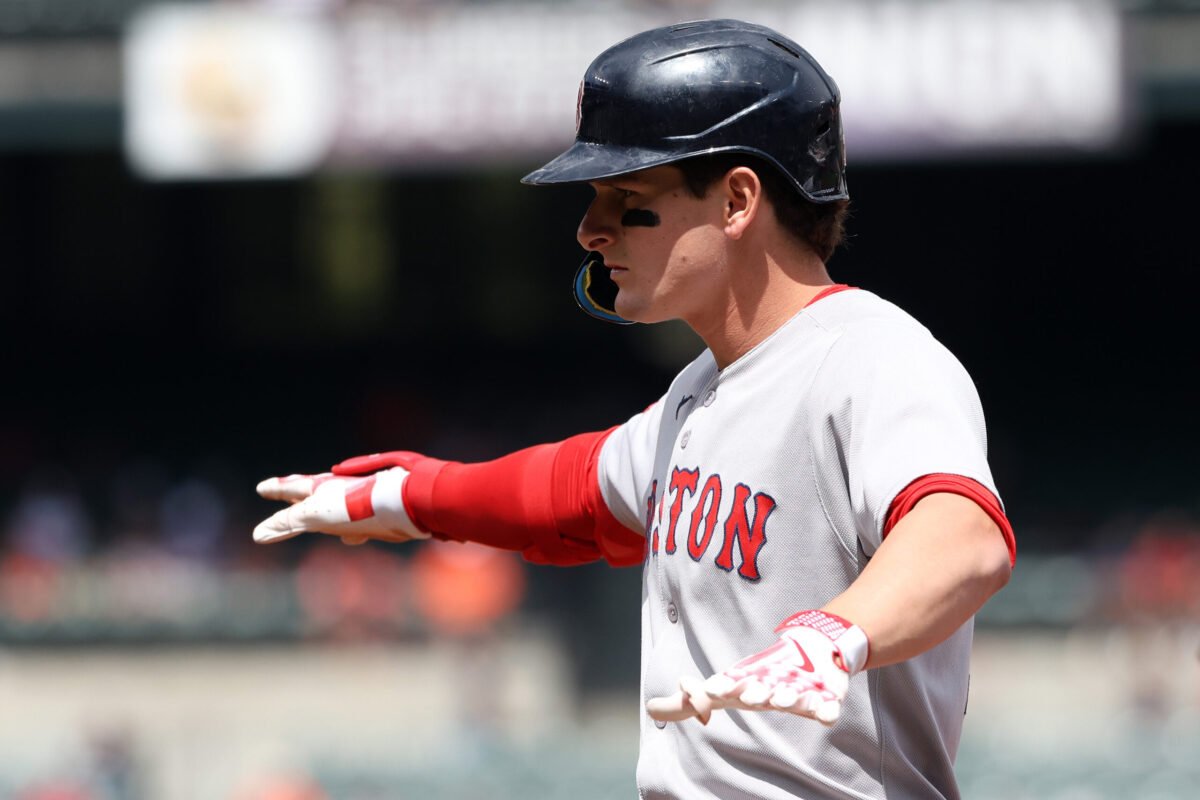
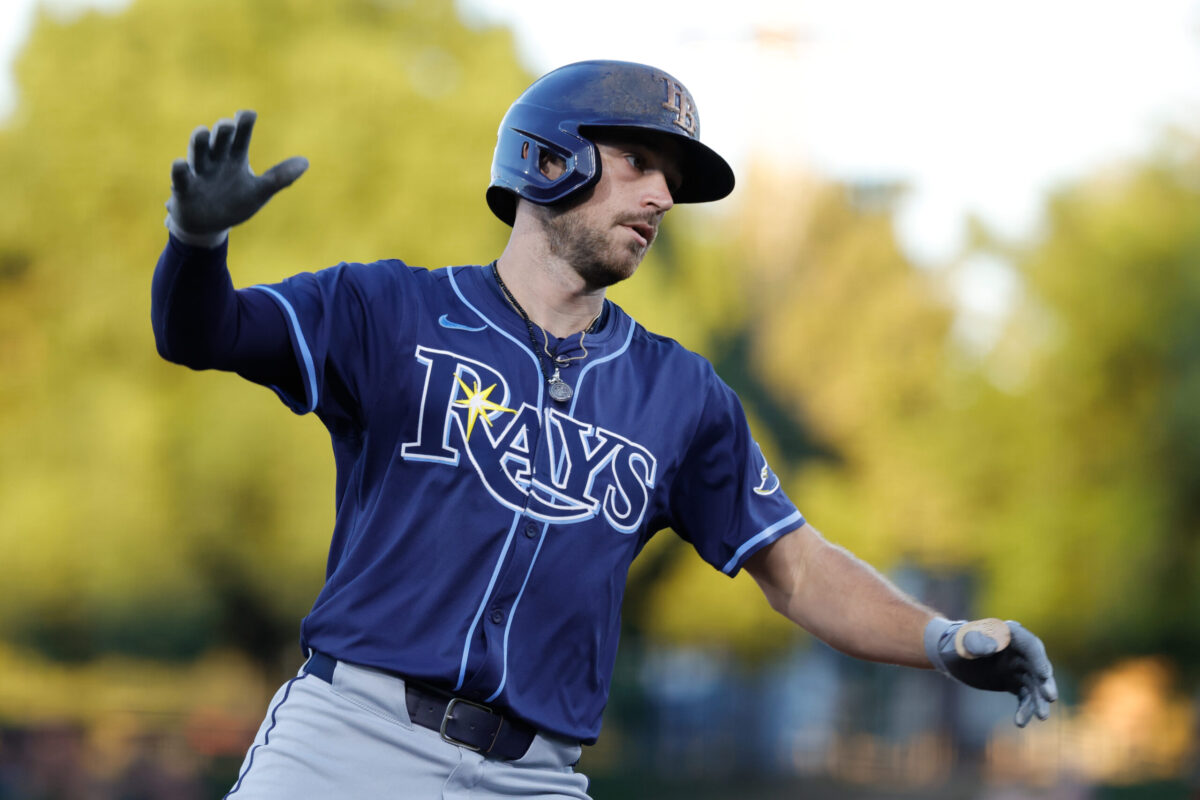
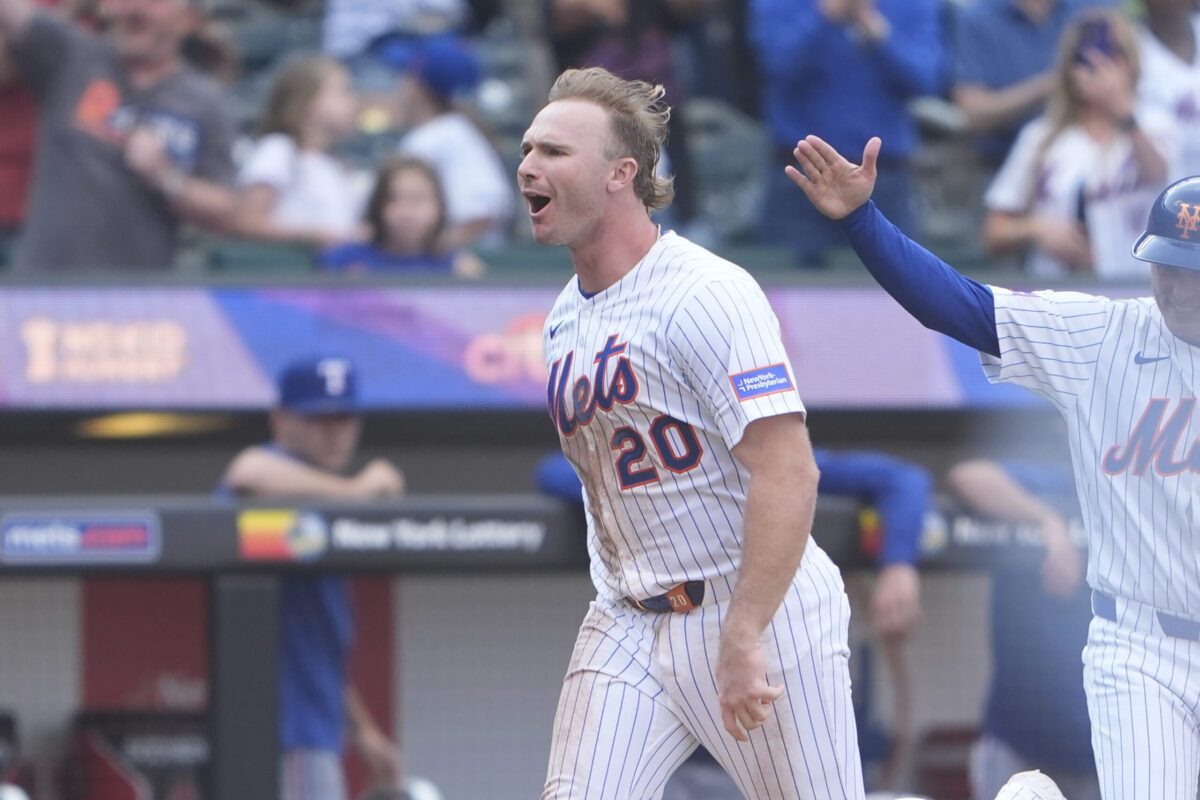
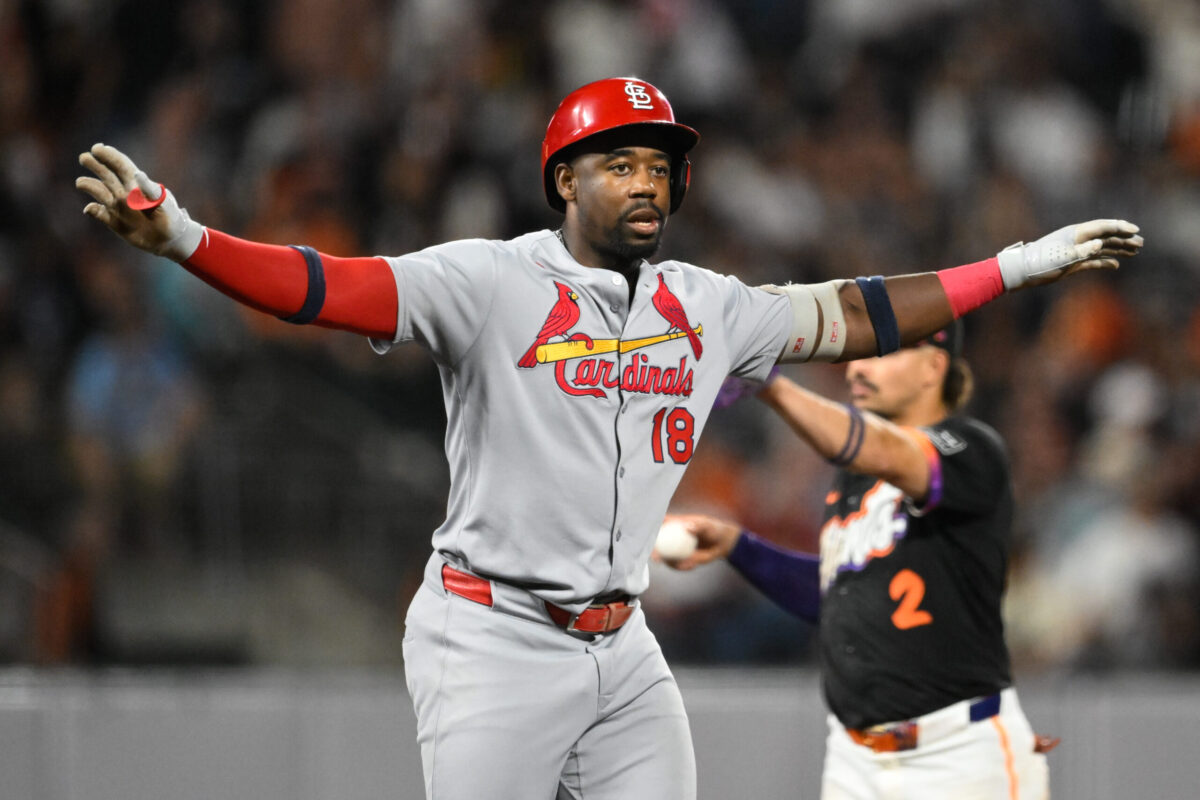
Munetaka Murakami is a Chicago White Sock! That’s a sentence I did not expect to type. The upside is obvious — with 70/70 Game Power, 80/80 Raw Power, and ISO marks of .392 and .390 in 2022 and 2025, the power is immense. The downside, though, is he fails to make enough contact to actually take advantage of those power skills. His SwStk% has risen for four straight seasons, while his Z-Contact% is bad, very bad. He does walk a lot, which could make him a far better risk in OBP formats. Outside of such leagues, and in the format these rankings are based on, he’s the epitome of a lottery ticket.
Josh Bell joins his sixth team since 2022, becoming the Twins’ new regular first baseman. He’s coming off his third highest xwOBA, thanks to a career best strikeout rate, while a career high FB% is a good sign for his home run potential, if repeated, of course. He also posted the second highest HardHit% and Barrel% of his career, but those surges didn’t impact his HR/FB rate much. We still haven’t seen the peak power he last showed back in 2021, but even at age 33, it appears his power skills remain intact.
Spencer Steer posted an identical wOBA as his 2024 season and his fantasy contributions were similar, except for one glaring difference. His stolen base total declined from 25 to just seven, which really cut into his fantasy value. He continues to remain an excellent basestealer, so he should run more often, but it’s anyone’s guess whether that will actually happen. Update: Eugenio Suarez’s signing clouds his PT outlook, as he’ll likely be competing with Sal Stewart for PAs.
Ernie Clement makes fantastic contact…and that’s about it. He has oddly been a fly ball hitter the last two seasons despite owning limited power and that has hampered his BABIP. He could be of more use in batting average if he optimized his batted ball type profile, so we’ll see if that ever happens. For now, he looks like a light contributor across the board, but with risk of losing playing time and becoming merely a super utility guy.
After disappointing offensively in previous chances, former top prospect Miguel Vargas finally completed a full season in the Majors and hit respectably. His batted ball type profile is fascinating, as he has been an extreme flyball hitter, despite posting only mid-single digit HR/FB rates. However, his Statcast power metrics suggest much higher marks, so there’s seemingly some additional home run upside. It’s too bad all those flies have crushed his BABIP and batting average.
It’s been two seasons so far for former top prospect Colt Keith and he has yet to deliver much fantasy value. His Statcast power metrics did surge in 2025,, but his HR/FB rate only increased marginally. Without much speed, he’ll need to recapture the power he showed back in the minors. Don’t forget he’s entering just his age 24 season, so he’s got plenty of time for the power to reappear.
Ryan O’Hearn joins the Pirates and figures to serve as the team’s starting DH. Since he first broke out with the Orioles in 2023, he hasn’t shown much of an opposing handedness split, which eliminates the risk he’ll fall into a short-side platoon role. He’s shown some solid all-around skills in recent seasons, but simply doesn’t possess the power necessary to be an impact fantasy corner guy, as his Barrel% has hovered around league average most of his career. The move to Pittsburgh’s PNC Park won’t help any in that department, as it has been one of the toughest parks for left-handed home runs.
It was another lost season for Triston Casas, who has now missed significant chunks of time to injury two years in a row. The skills here are pretty good all around, and he enjoys a significant boost in value in OBP leagues thanks to the double digit walk rate. If he manages to stay healthy all year, he would be a near lock to deliver significant profit to his fantasy owners. The arrival of Willson Contreras clouds Casas’ playing time outlook, but you have to imagine more moves are coming to ensure regular at-bats. If not, he’ll be dropped from the rankings.
Gavin Sheets enjoyed his first season with the Padres, as he posted his highest BABIP and HR/FB rate. All of his Statcast power metrics spiked and actually suggest higher than the low double digit HR/FB rate he recorded. With decent other skills across the board, he should at least be as good as he was in 2025. However, his history shouldn’t be totally ignored, which makes him a risk if you’re counting on him to remain a starter all season.
A career best walk rate led to Jake Cronenworth’s highest wOBA since his first full season in 2021, but it failed to deliver positive fantasy value. With little speed, middling power, and a weak batting average, he’s a classic accumulator whose value is strictly tied to his everyday role.


