Ottoneu Cold Right Now: April 17, 2023

Much like Hot Right Now, Cold Right Now will be a weekly Ottoneu feature, primarily written by either Chad Young or Lucas Kelly, with a focus on players who are being dropped or who maybe should be dropped in Ottoneu leagues. Hot Right Now will focus on players up for auction, players recently added, and players generally performing well. Cold Right Now will have parallel two of those three sections:
- Roster Cuts: Analysis of players with high cut% changes.
- Cold Performers: Players with a low P/G or P/IP in recent weeks.
There won’t be a corresponding section to Current Auctions because, well, there is nothing in cuts that correspond to current auctions.
Roster Cuts
Ross Stripling, Leagues with a Cut (7 days) – 28.52%
With a report that Stripling will be working out of the bullpen for the foreseeable future, he loses much of his fantasy value. In his one start of the year, he gave up four earned runs and three home runs. His pitch mix is a little all over the place as he appears to be working on a splitter and is sticking with the sinker he started throwing last year. His velocity appears to be unchanged from last year except that he is throwing his changeup significantly harder. Whatever the issue is, Stripling needs to work through it as a reliever and will need some time to get right before he becomes fantasy relevant again.
Farhan Zaidi: Sean Manaea has ‘earned’ rotation spot, Stripling to bullpen https://t.co/rmHBxByqWL
— Mercury News (@mercnews) April 14, 2023
Austin Meadows, Leagues with a Cut (7 days) – 28.2%
The left-handed DH/OF is struggling with anxiety and was placed on the 10-Day IL at the end of last week. He had a big season debut going three for four with a double but then fell into a mini-slump. Hopefully Meadows will be able to get back out on the field soon. He’s projected to slug in the .430 to .460 range, well above the 2022 MLB average of .395.
Taylor Rogers, Leagues with a Cut (7 days) – 22.44%
Rogers is expected to play a setup role to Camilo Doval (Roster Resource) and maybe some fantasy managers were hoping it would be the reverse. Rogers had a rough go to start the season in San Francisco. He’s given up an earned run in four out of his six appearances and in one of those appearances he gave up four earned runs. He also gave up a home run in each of his first two appearances. It could just be a rough start to the year and it could be the beginning of some skills decline but it’s too early to tell.
Seth Brown, Leagues with a Cut (7 days) – 20.83%
Another injury has managers cutting Brown as he is expected to be out in the four to six-week range with a Grade 2 left oblique strain. Fantasy managers know just how tricky oblique strains can be and are reacting accordingly.
Trevor May, Leagues with a Cut (7 days) – 19.55%
With an ERA creeping above 8.00, May has had one too many poor outings for fantasy managers to deal with. In one appearance against the Rays, May gave up four walks and two earned runs before recording a full inning pitched. The 33-year-old right-handed reliever has always maintained a higher-than-average K/9, but his BB% has bounced above and below league average in his career:
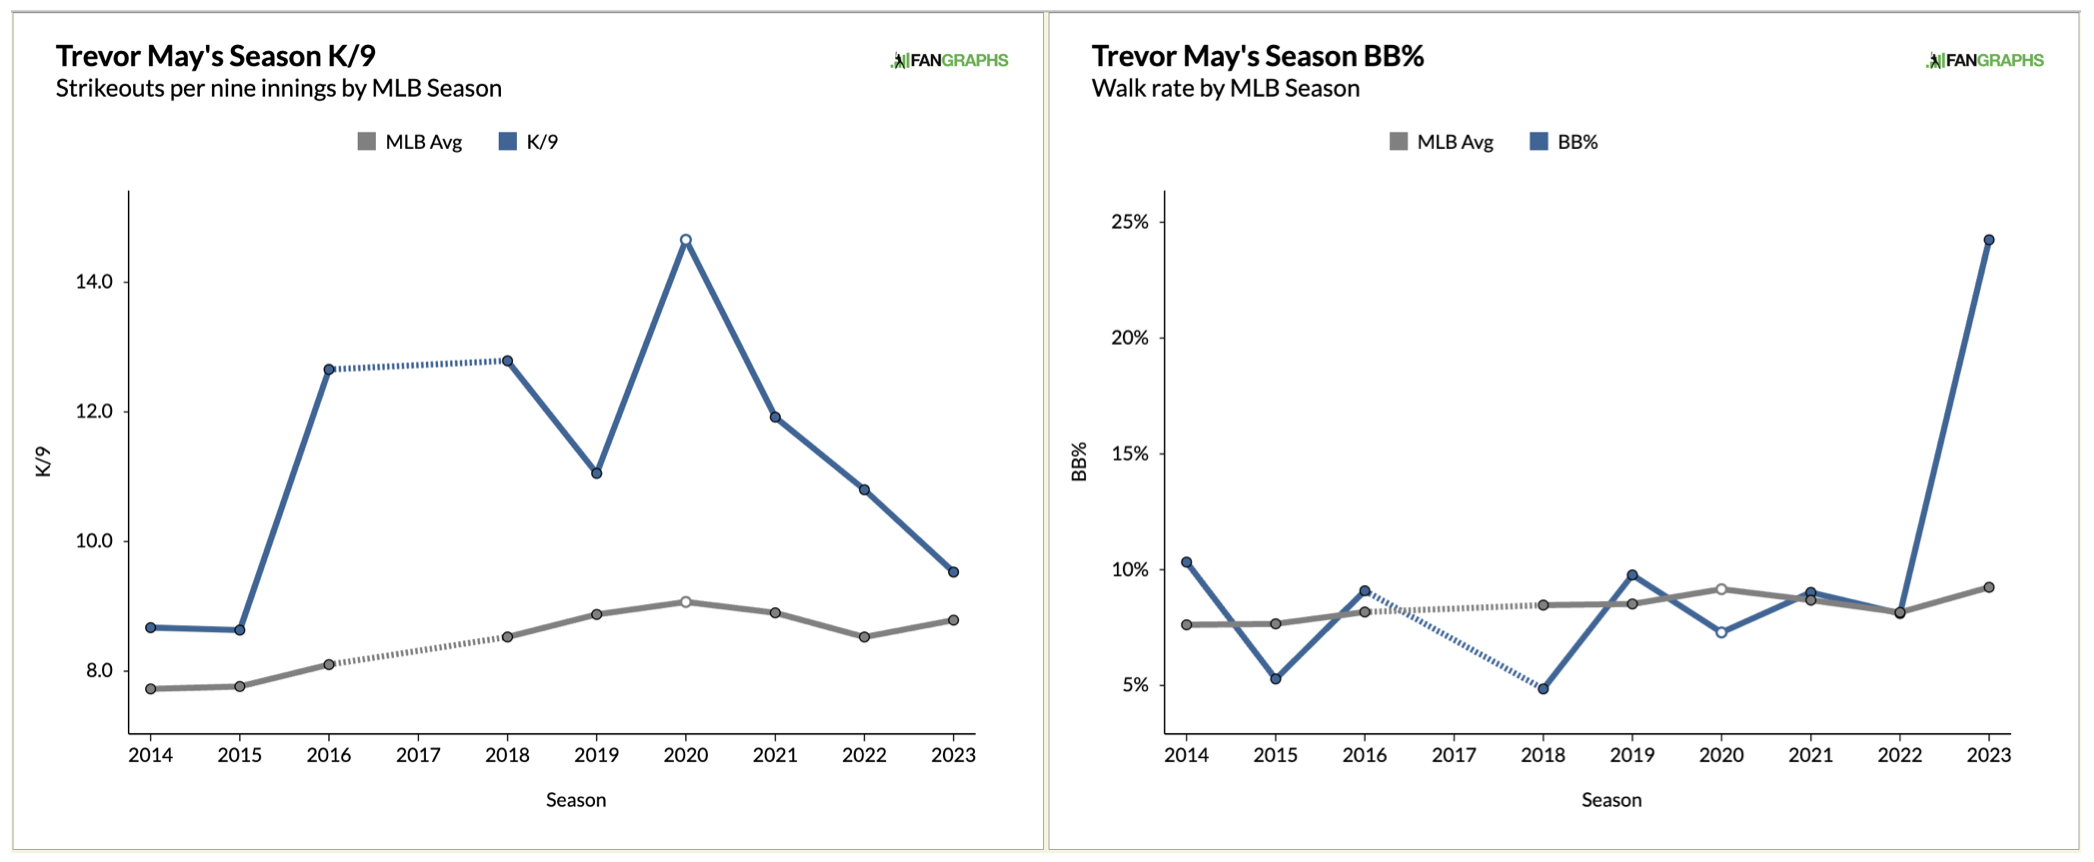
Click to enlarge
With both his fastball and sinker declining in velocity this season, May is an easy cut in fantasy leagues.
Cold Performers
Kolten Wong: 41 AB, .098/.208/.098, -0.26 P/G
In Jeff Zimmerman’s latest lineup analysis, he wrote:
“Kolten Wong (vs RHP) and Sam Haggerty (vs LHP) are in a second base platoon.”
Wong has gone 0-3 against lefties and 5-48 against righties. I don’t think anyone drafted Wong for his batting average as no projection system has him over .250, but many were probably drawn to the 10+ stolen base projections and he has yet to swipe a bag. But, even with a sad batting line, his BB% is above average:
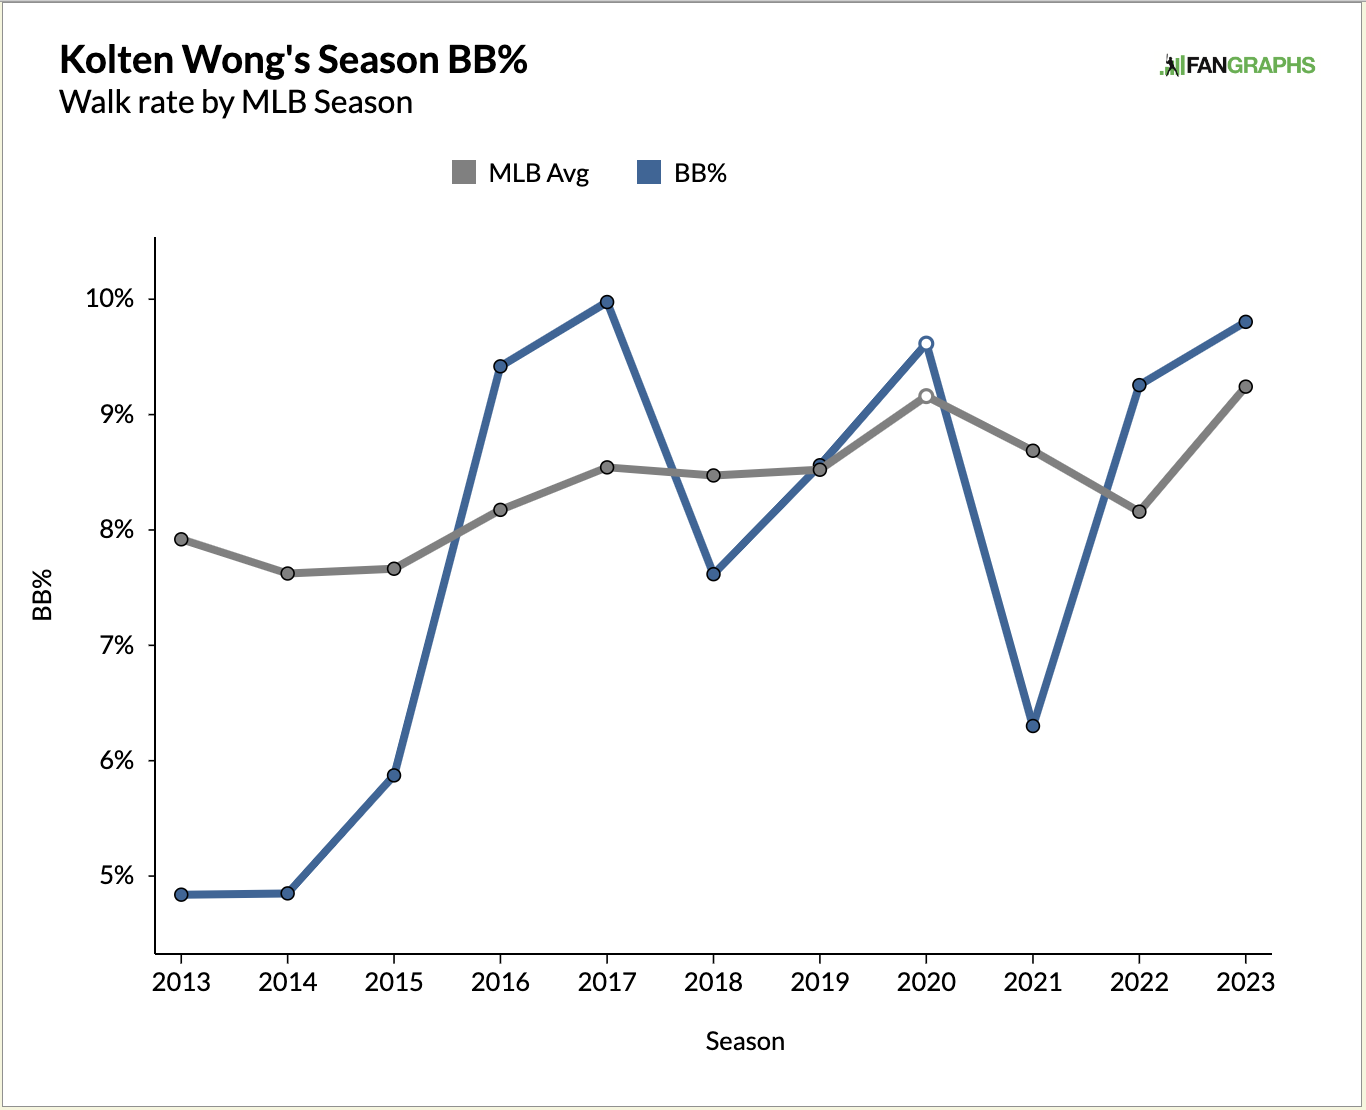
Hopefully, Wong will continue to help in the OBP department and starts to run again, but if he doesn’t I would consider him an easy cut.
Willson Contreras: 46 AB, .174/.255/.196, 1.33 P/G
In his new home in St. Louis Contreras is struggling, but he is a streaky hitter. He opened the season with a four-game hitting streak, followed that up with a two for 34, then went 2-5 in yesterday’s game. There hasn’t been much change in his swing profile, he has hit a ball 115.1 MPH, very close to his career max, and all of his x-stats are higher than his actuals:
AVG: .200 xAVG: .229
SLG: .240 xSLG: .345
wOBA: .249 xwOBA: .292
Just wait it out, Contreras will very likely be the hitter projection systems expect him to be.
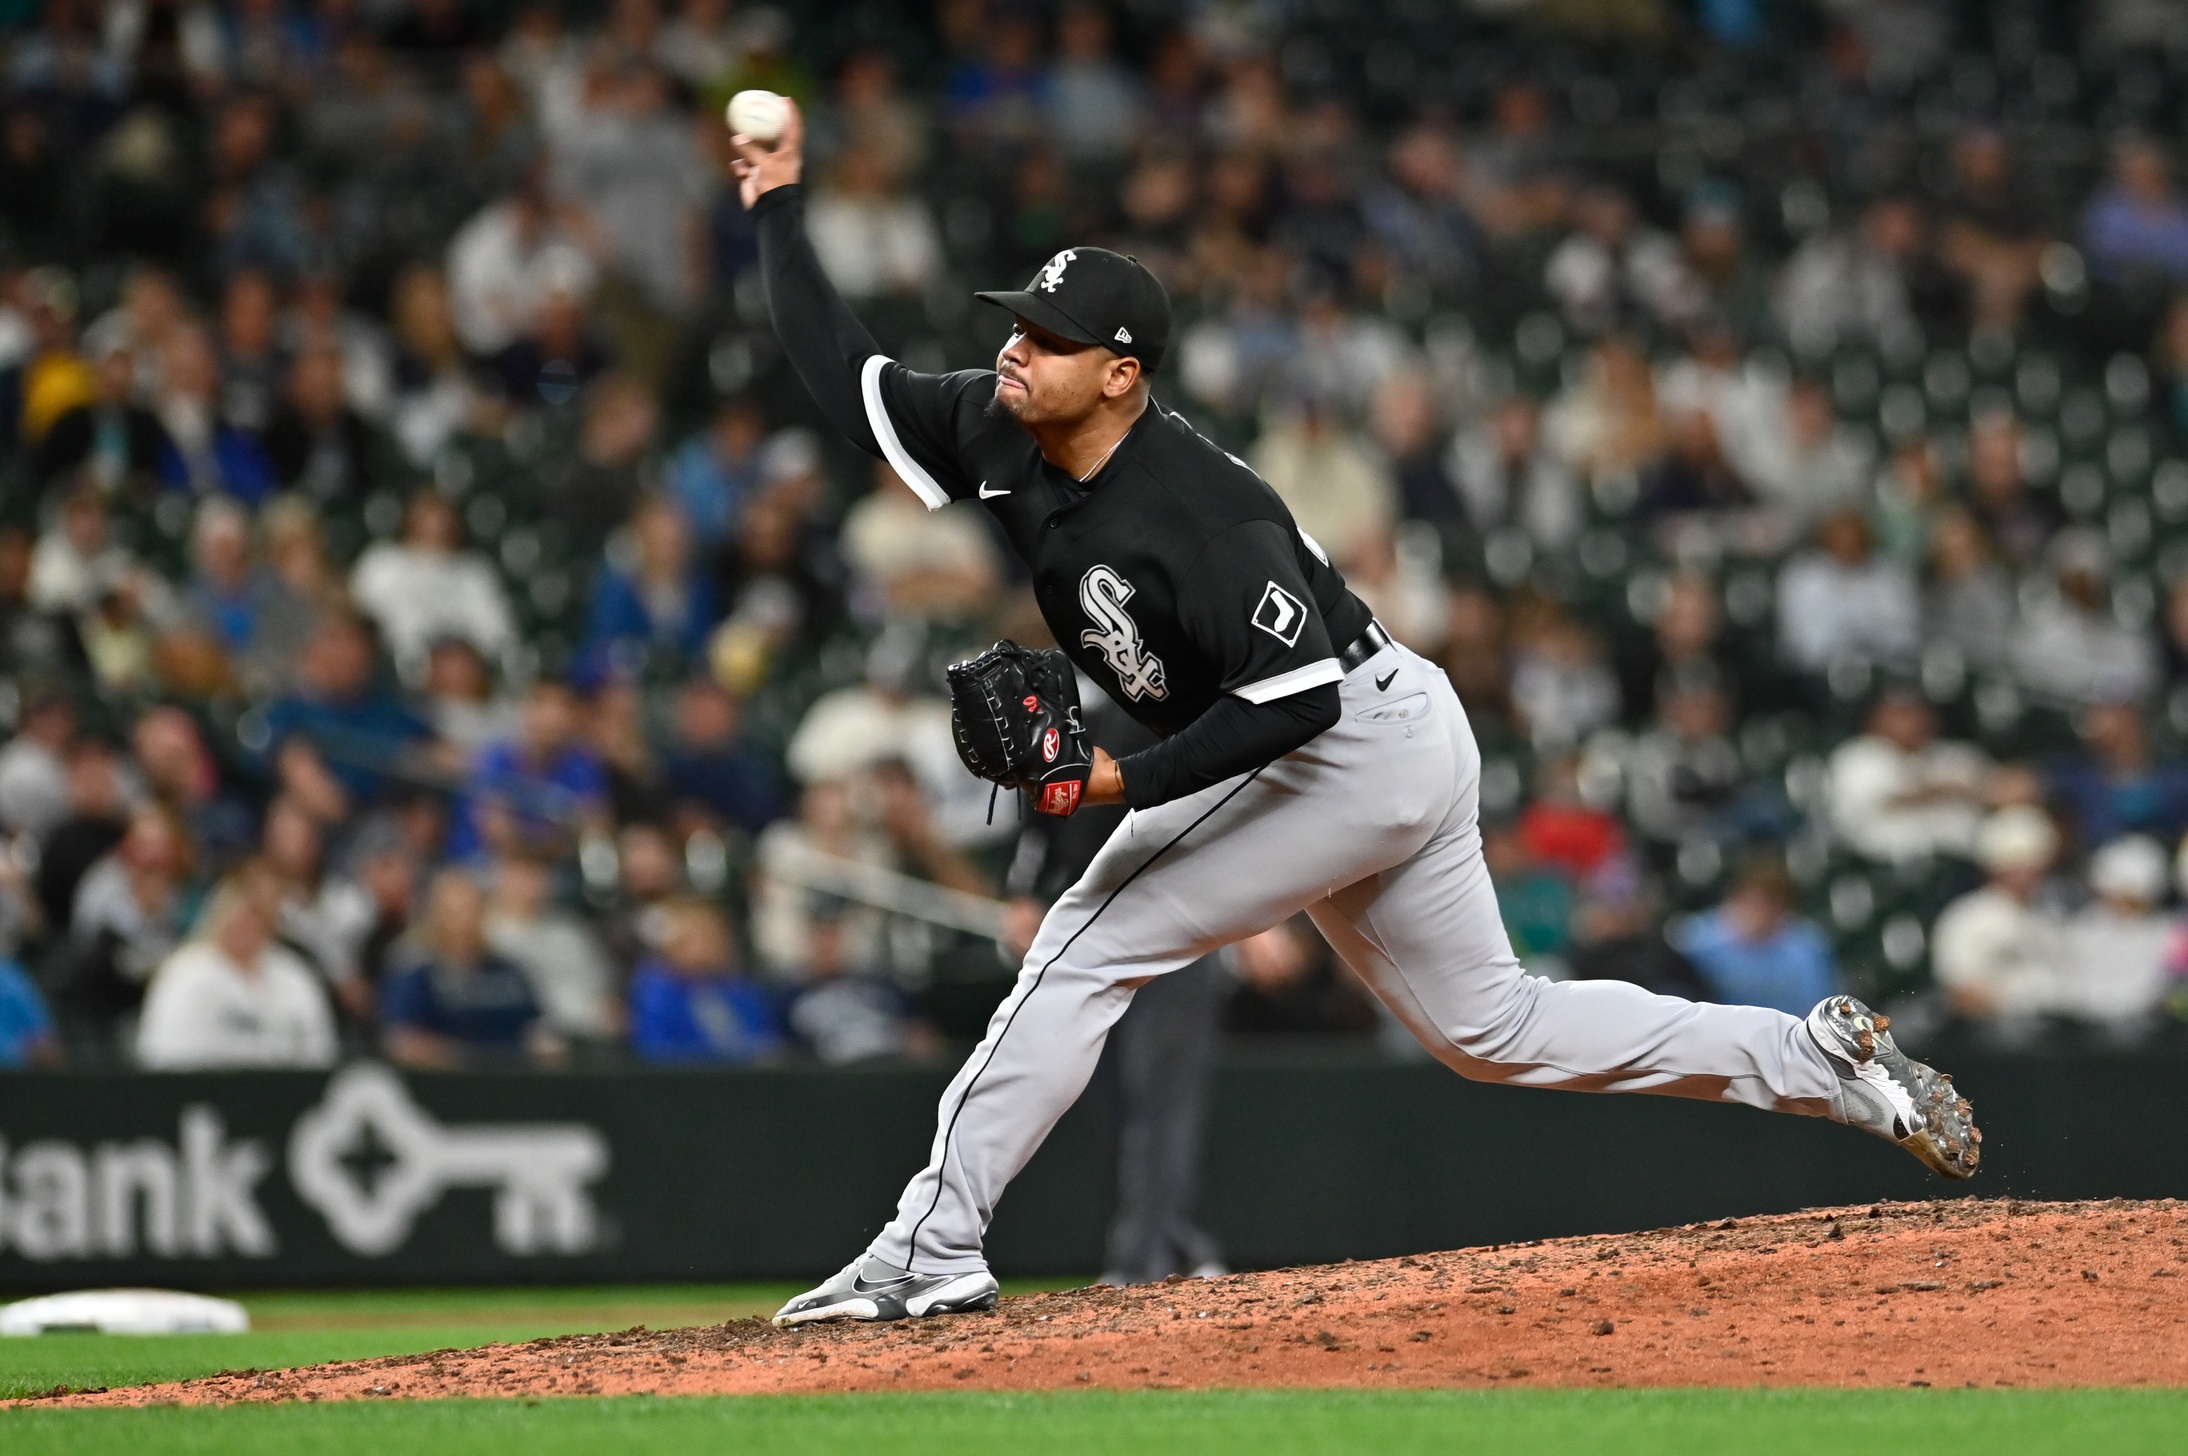
Michael Kopech: 15.2 IP, -0.88 P/IP
Kopech’s game logs are scary looking. In three outings this season he has given up 11 earned runs, seven home runs, and 1o walks. He needs to, at the very least, be benched until something is figured out. Each one of his pitches, except the curveball, which he utilizes the least, has an xBA, xSLG, and xwOBA higher than the actuals. His curveball, slider, and fastball have all given up home runs this season and his fastball has lost nearly 2 inches of vertical movement (BaseballSavant, vs. AVG measurement). Is it possible that Kopech is not a starter? Whatever the case may be, he is simply not worth starting in any fantasy format.
Tyler Anderson: 14.2 IP, -0.64 P/IP
Are people already saying, “Told ya so”, about Anderson coming back down to reality from his excellent 2022 season? I hope not. In his first outing, he only gave up four hits but tacked on two walks. He seems to be struggling with his command to open up the season as his BB% is higher than it’s ever been and his K% is lower than it’s ever been:
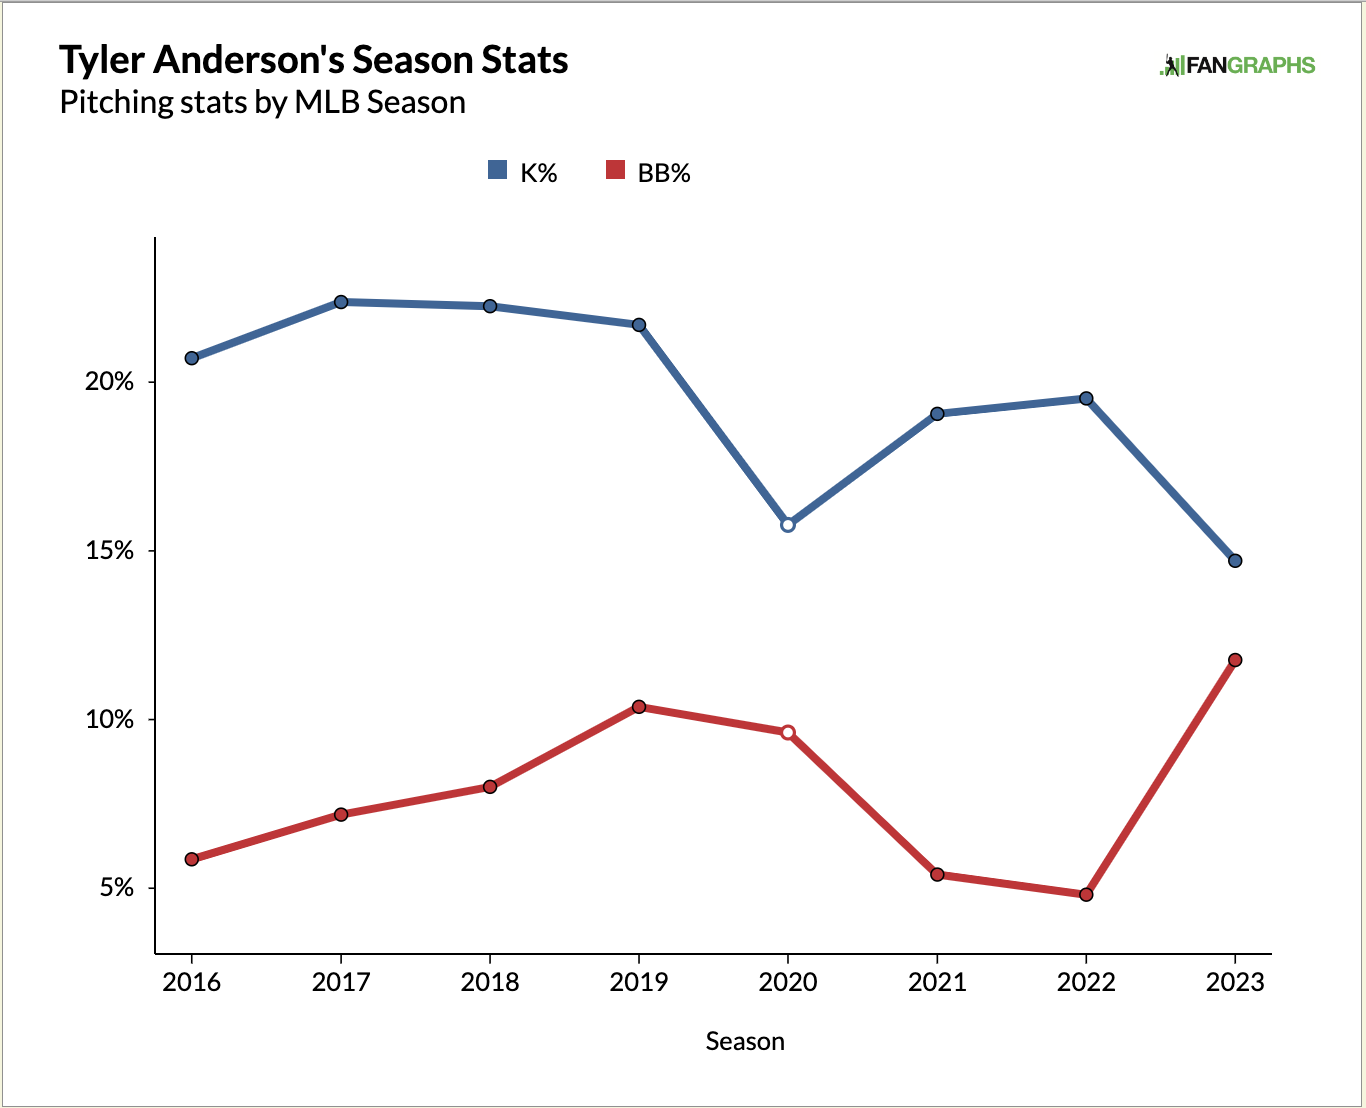
He’s not getting hit harder, his velocity isn’t down enough to raise any red flags and his BABIP is currently .318. I predict a rebound after a few more outings. How about his stuff? Here’s a comparison between this season and last season:
| Season | Stf+ FA | Stf+ SI | Stf+ FC | Stf+ CU | Stf+ CH |
|---|---|---|---|---|---|
| 2022 | 95 | 86 | 95 | 93 | 81 |
| 2023 | 95 | 86 | 95 | 93 | 81 |
I’m not exactly sure if 14.2 innings are enough to get a good Stuff+ metric (I still have some learning to do in that department) but if it is enough to explain how Anderson’s pitches are performing, they are unchanged from last season as of now.