Much like Hot Right Now, Cold Right Now will be a weekly Ottoneu feature with a focus on players who are being dropped or who maybe should be dropped in Ottoneu leagues. Hot Right Now will focus on players up for auction, players recently added, and players generally performing well. Cold Right Now will have parallel two of those three sections:
- Roster Cuts: Analysis of players with high cut% changes.
- Cold Performers: Players with a low P/G or P/IP in recent weeks.
There won’t be a corresponding section to Current Auctions because, well, there is nothing in cuts that correspond to current auctions.
Roster Cuts
Roansy Contreras, Add% (-) Change (7 days) – 19.23%
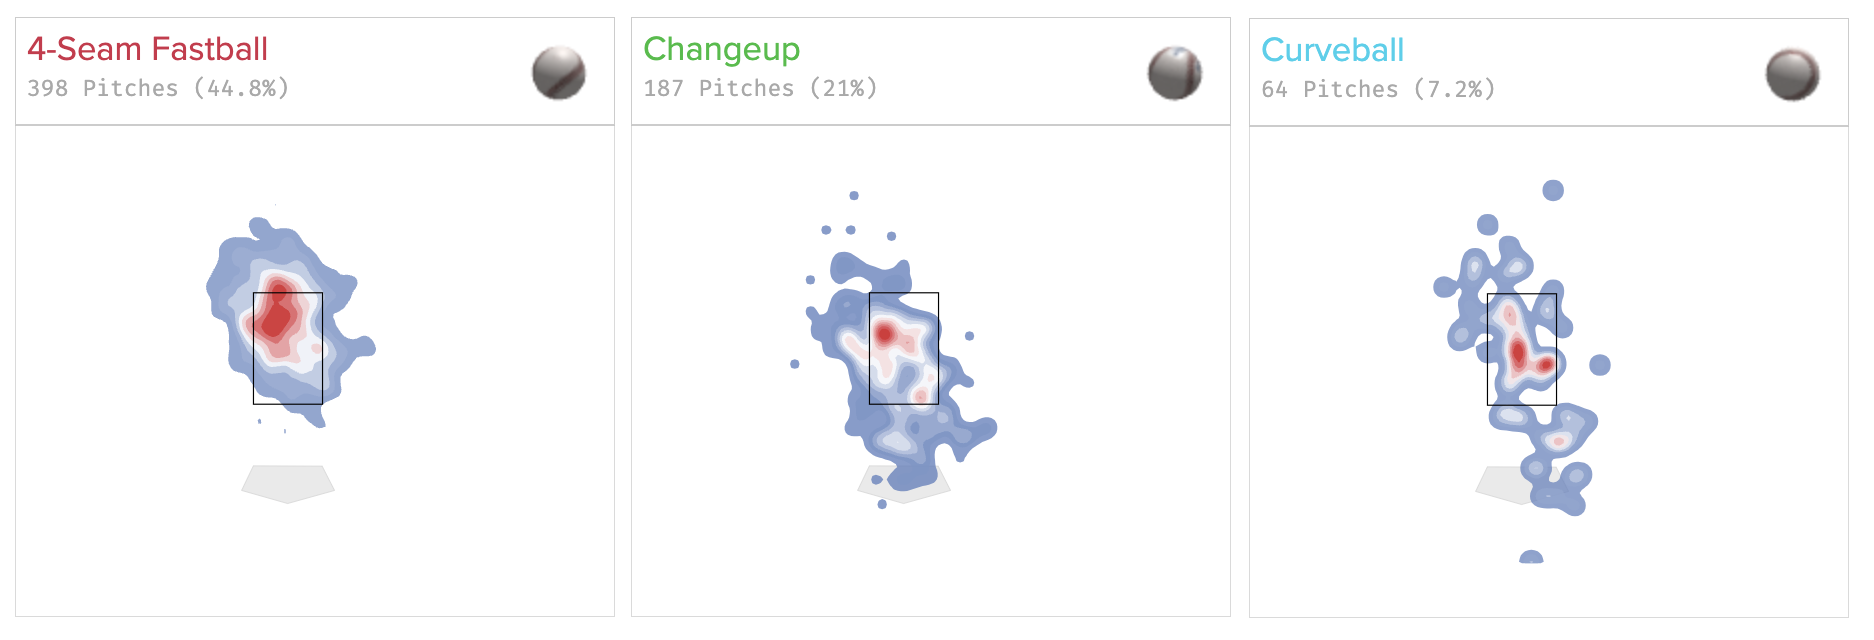
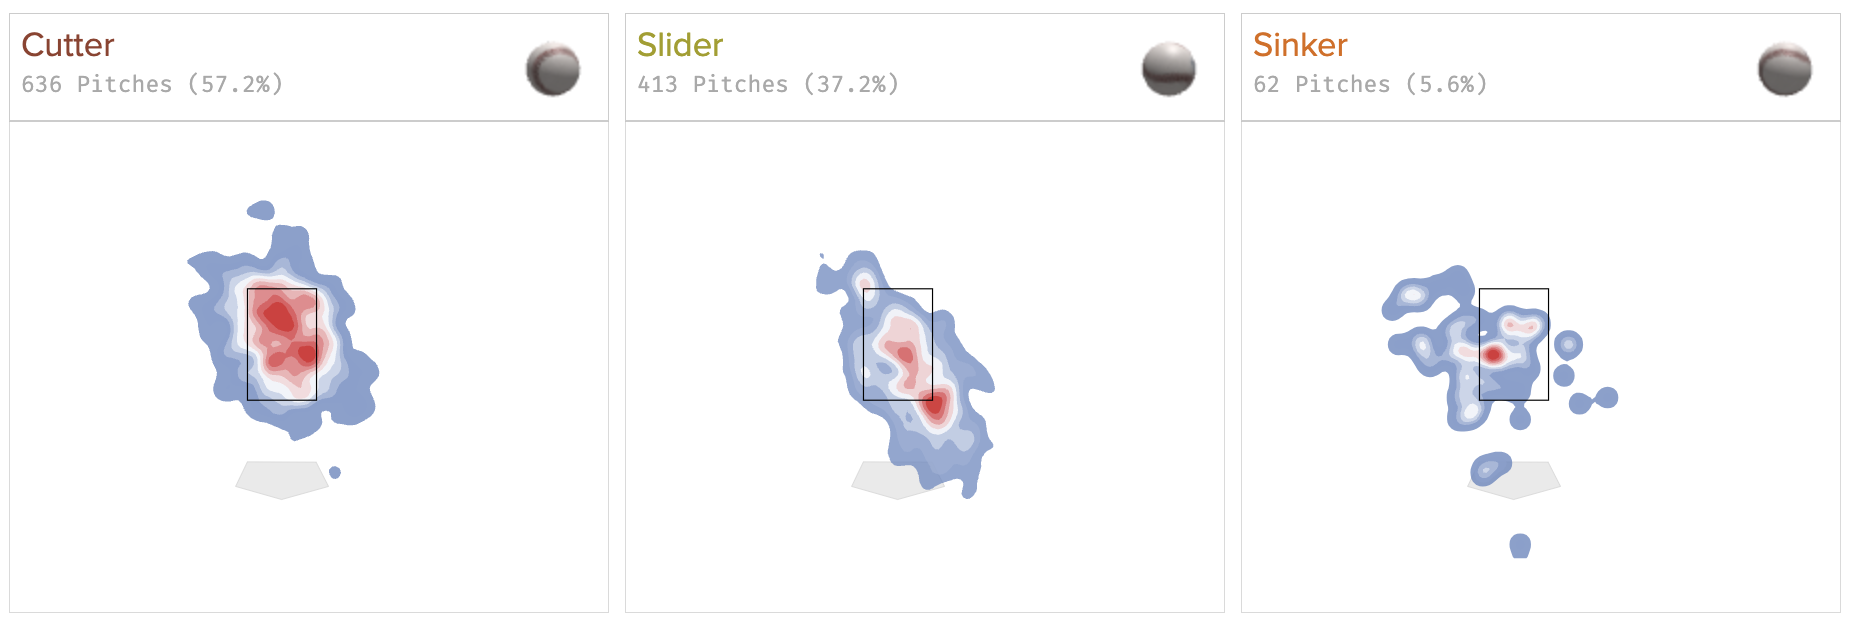
Yet to appear after being moved to the bullpen, some managers are not willing to wait around to see if Contreras can work his way back into the rotation. In 11 starts in 2023, his 6.87 K/9 is below all his projected marks, and his BB/9 is above his projected marks. His velocity continues to trend down slightly since his MLB debut and the batting average against his fastball in 2023 is an astounding .415. On the flip side, his slider has performed impressively well, being hit for an average of only .194. Contreras has a good curveball to go along with the slider, it currently holds a 41.9% whiff rate, but good secondaries are difficult to rely on without a solid fastball and that’s what Contreras will need to work on out of the pen. If I had been rostering Contreras for a good price, I would still be holding, not dropping. He’s only 23 and still has a lot of potential.
Graham Ashcraft, Add% (-) Change (7 days) – 15.71%
After taking a come-backer off the calf, Ashcraft will spend some time on the IL. His 2023 game logs are not pretty. In four of his last seven starts, he has given up seven or more runs. In all of his last seven starts, he has given up at least three runs. Amongst pitchers with at least 60 innings this season, Ashcraft has the third-worst ERA, the eighth-worst FIP, and the fourth-worst K-BB%. While there is a lot to like about Ashcraft from a “Stuff” perspective as was pointed out earlier in the year by our own Nicklaus Gaut, his stuff is getting hit. Some research on pitchers with great stuff who get hit would help give some understanding as to what is going on.
Nick Senzel, Add% (-) Change (7 days) – 13.15%
With a slash line of .258/.332/.380 and more time spent on the IL, it’s not surprising to see Senzel’s drop rate increase. The now 27-year-old has played in over 100 games only twice in his career and has never hit above .260. His 2023 OBP (.332) is above league average (.319), but he is not stealing bases. He has never had a wRC+ over 100 and his slugging percentage has been far from the league average in his last three seasons. With the arrival of Elly De La Cruz and the success of Spencer Steer, Senzel will almost certainly have to find playing time in the outfield this season and his defensive marks on the year don’t lead you to believe he is a shoo-in at any one defensive position the rest of the season.
Chris Sale, Add% (-) Change (7 days) – 11.85%
It is simply sad to see Sale back on the IL with a “stress reaction in his left scapula”, but such is life. It’s difficult to hold on to Sale at this point as his estimated return is sometime in August. He showed a real return to form after a shaky start to the season, going eight innings in mid-May against the Cardinals while striking out nine and only walking one. If you have the IL spot available, it can’t hurt to hold on to Sale, but otherwise, he should be dropped.
Brandon Lowe, Add% (-) Change (7 days) – 10.90%
Rotowire expects that Lowe will return from a herniated disc injury in mid-July, but back injuries are so nagging and difficult to fully return from. Either way, Lowe finds himself on the 10-day IL after hitting nine home runs and slugging .398 in 2023. His batting average sits at a worrisome .205 and he continues to struggle against left-handed pitchers. But, his average against right-handed pitchers is not that much better. Lowe has power, no doubt, but the sacrifice you make to your OBP/AVG categories when you roster him is out of balance with the power he supplies. Before his injury, his 31.3% K% was a near career-high and though his BB% (11.9%) was career-high, it was not enough to get his OBP above .300.
Jeremiah Estrada, Add% (-) Change (7 days) – 10.89%
An imminent big leaguer in Eric Longenhagen and Tess Taruskin’s mid-May Cubs assessment, Estrada has appeared in 12 games and lasted 10.2 innings as a right-handed middle reliever. In that time he has put up an impressive 10.97 K/9, but a scary 10.13 BB/9. His ERA sits at 6.75 and his FIP at 9.08. These are not good numbers. Let our prospect experts, Longenhagen and Taruskin, tell you what you need to know:
His stuff isn’t so nasty that you can comfortably project him in a middle-inning role; instead, he’s forecast here as an optionable depth piece.
Cold Performers
To measure cold performers this week, I’m looking for players with low P/G or P/IP in the last 14 days.
Anthony Rizzo, -2.25 P/G:
It seems obvious that Rizzo’s Hard% decline is related to his HR/FB rate and wOBA decline. But, his K% has gone up due to an increased O-Swing% (~+5%), decreased O-Contact% (~-6%) and an increased CSW% (~+4%) when compared to his career marks:
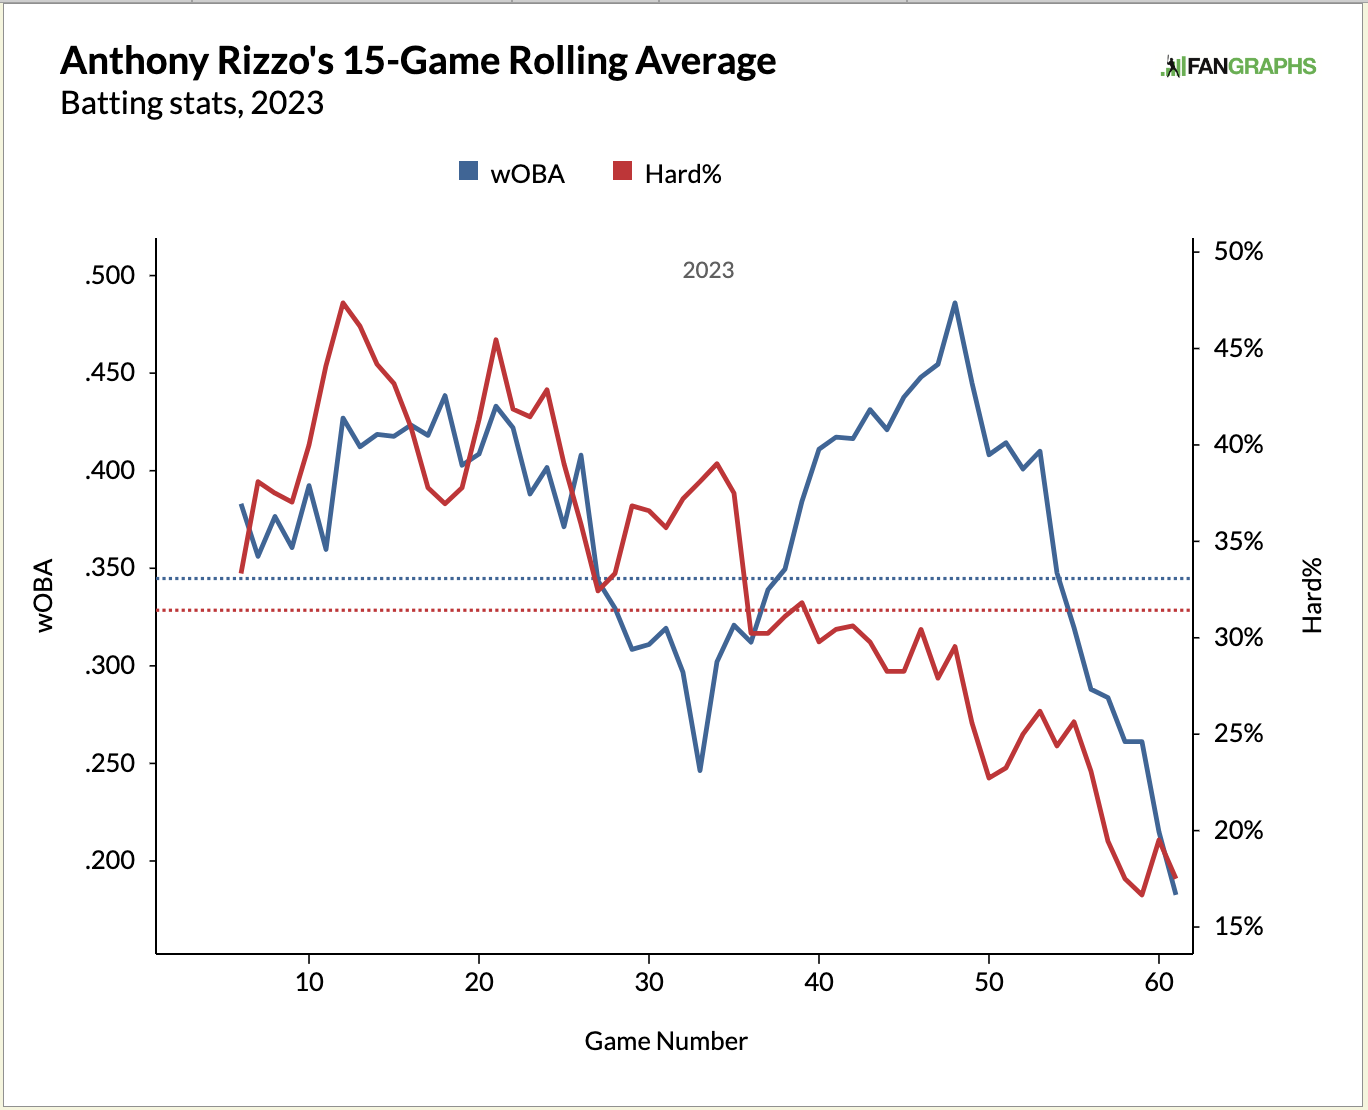
He is probably still working through neck and back issues that had him out earlier in the year and swinging hard when you have those types of injuries is very difficult. Keep an eye on his playing status as more off days could be telling of a more serious issue. But, Rizzo is a tough hitter and a good hitter and he should soon get back to his average marks if he can start to feel a little better physically.
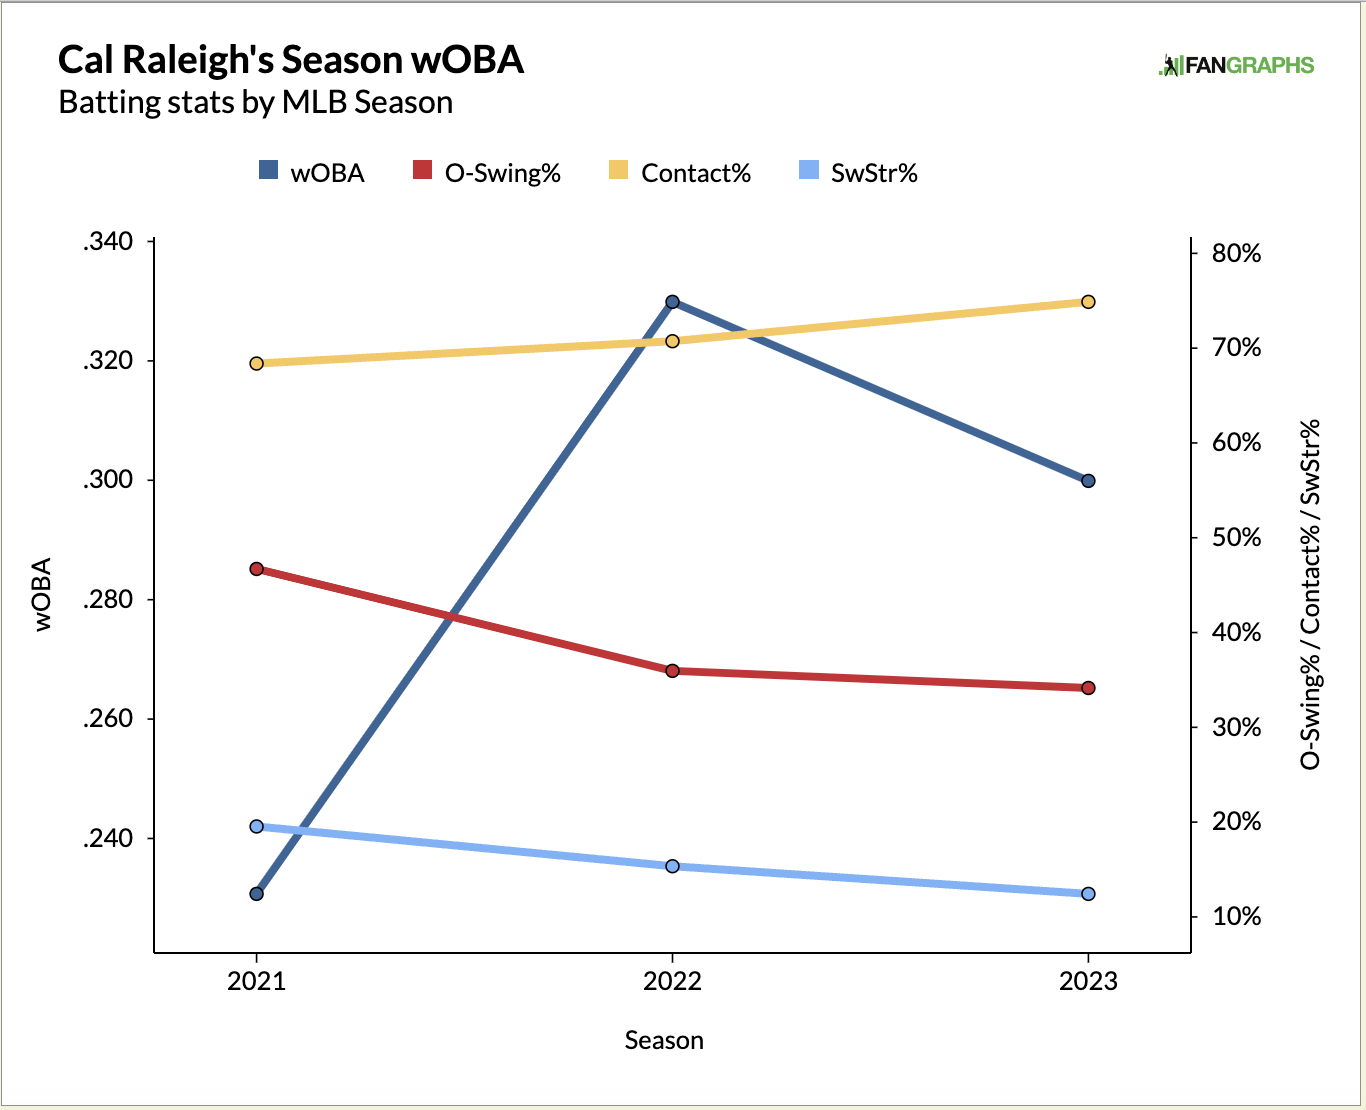
Cal Raleigh, -1.22 P/G:
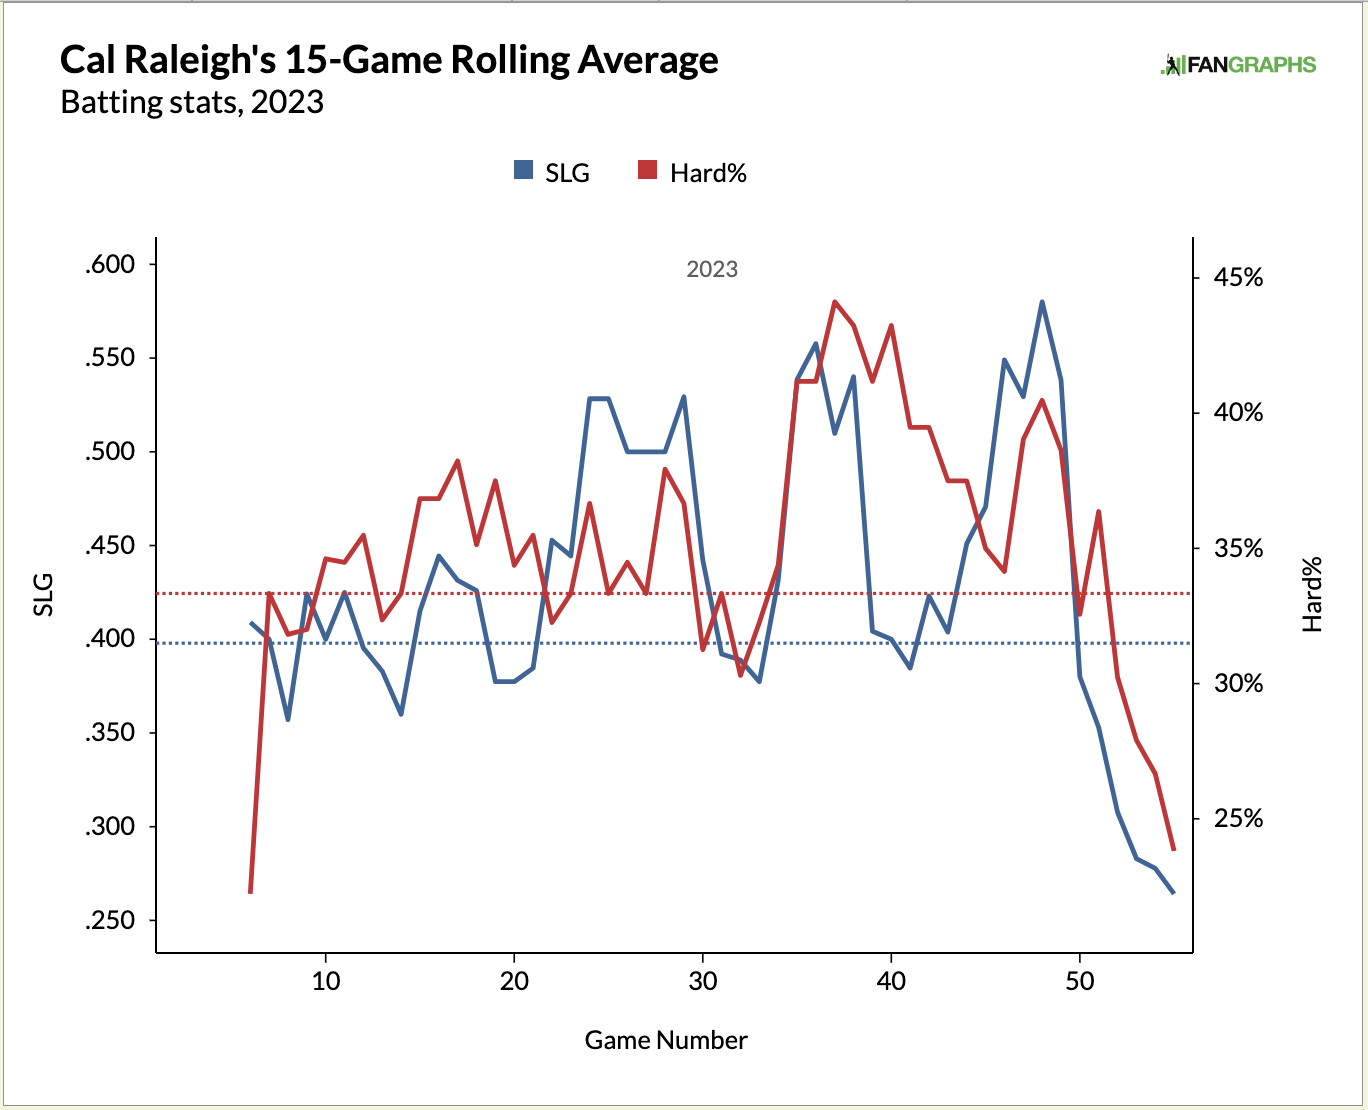
Raleigh only hit one home run in the second half of May and he has not yet hit a home run in the month of June. He is really struggling against right-handed pitchers, batting only .204 and slugging .395. What is interesting however is that Raleigh’s plate discipline metrics are trending, mostly, in the right direction. He is making more contact, swinging outside of the zone less often, and swinging and missing overall less often.
His troubles can be pinpointed to when he does make contact as he’s not hitting the ball as hard as he used to on a consistent basis and that’s where Raleigh has done damage in the past:
Luis Severino, -4.67 P/IP:
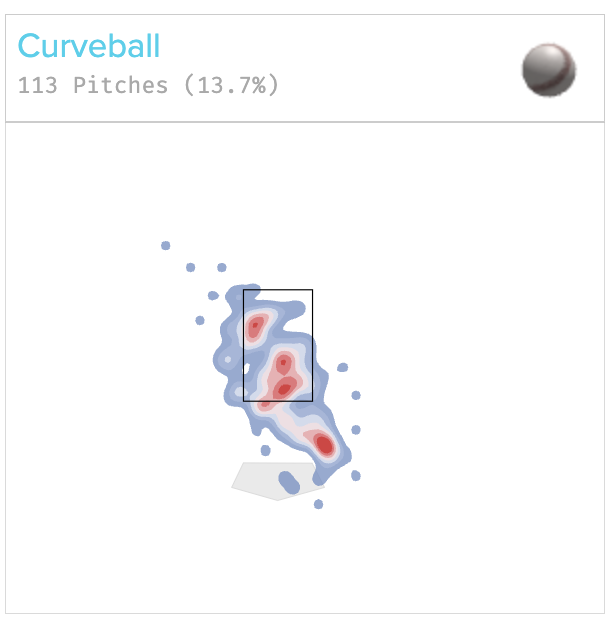
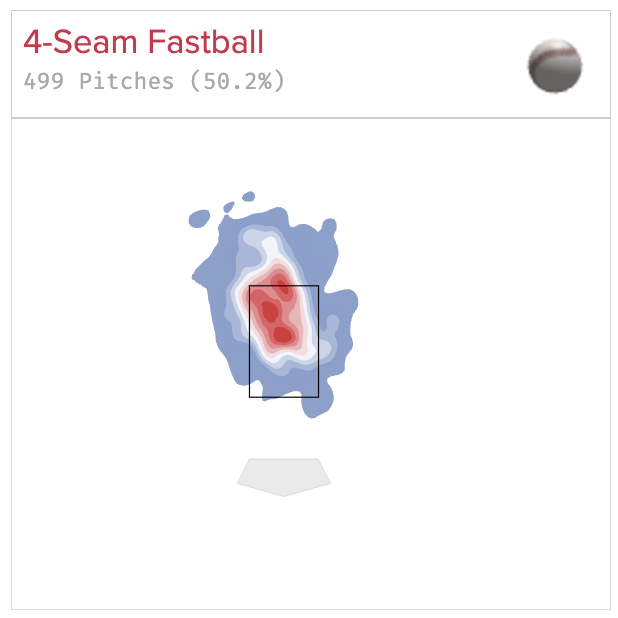
Severino’s fastball velocity dipped back down to 95.6 MPH after reaching 98.0 MPH in a start at the end of May. He has only had four starts so far this year and in his last two starts, he has given up three home runs. His fastballs (cutter and four-seamer) are getting hit with batting averages above .300. His slider has been his best pitch so far this year from a swing-and-miss measurement, but he is throwing it slightly less often. It may take another couple of starts to work through a better gameplan/pitch-mix, so keep an eye on Severino in hopes that his velo will go back up and he will start limiting hard contact once again.
Bryce Miller, -4.86 P/IP:
After an excellent start to the season, Miller’s last two appearances were rough. He gave up eight earned runs and two home runs on May 29th and he gave up seven earned runs and one home run on June 4th. He still only has 5 walks in 38.1 innings, but hitters are catching on to the fact that he puts the ball in the zone with regularity and have begun hitting the ball hard:
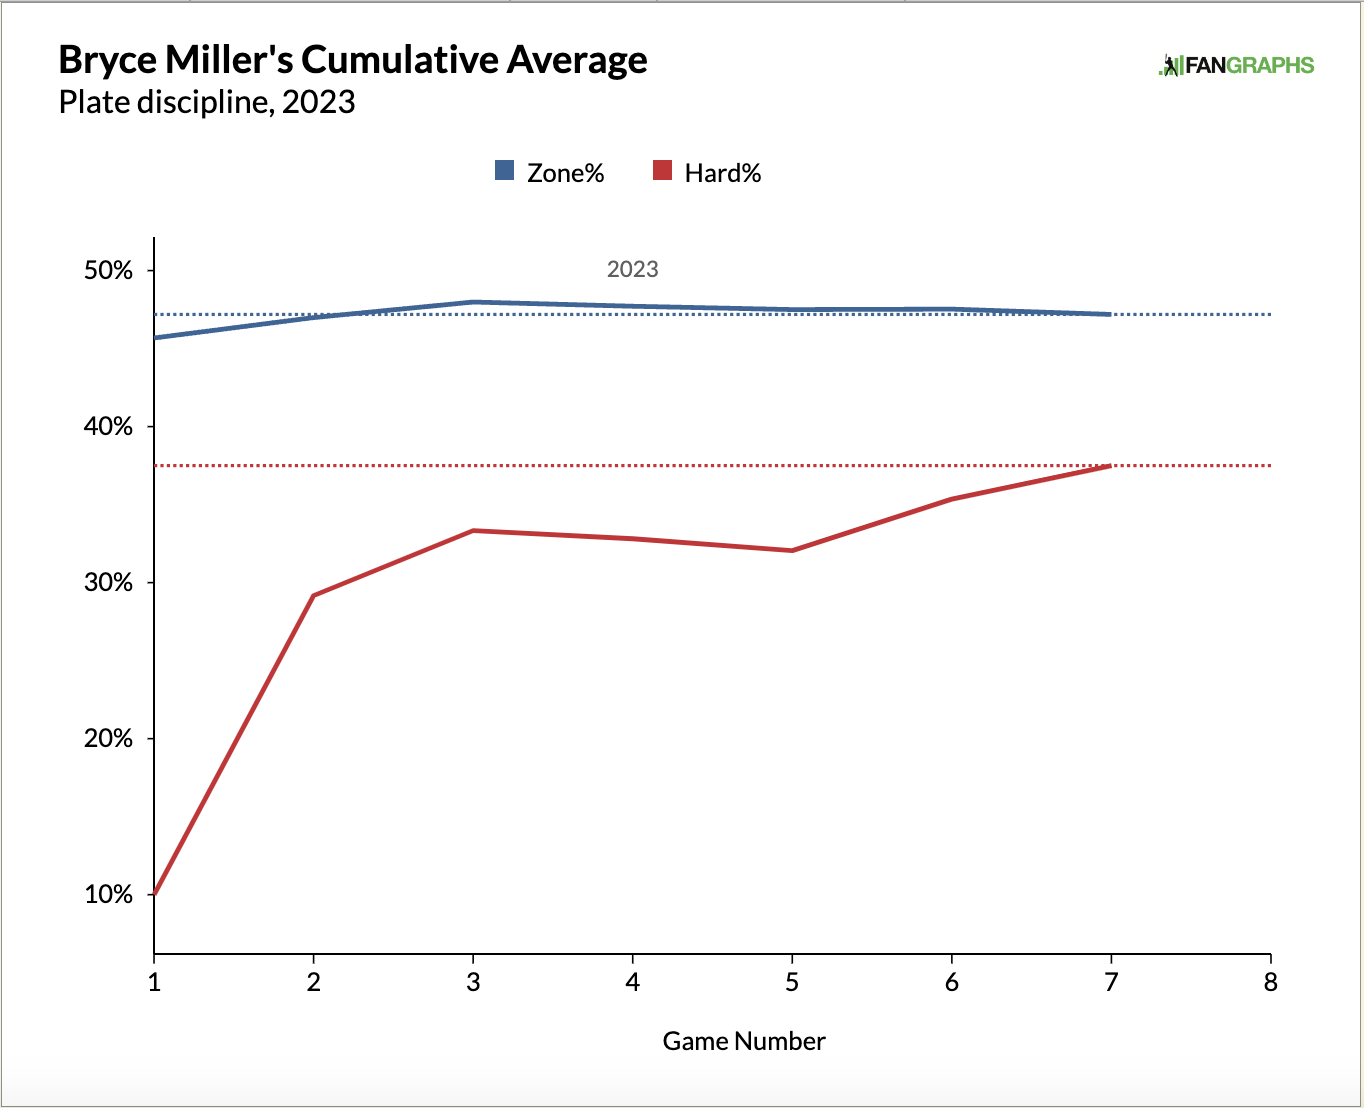
Miller will have to find a balance between being a pitcher with an impressive 18.4% K-BB%, compared to the league average among starters of 13.8%, and a pitcher who gives up hard contact. While his fastballs are performing well from a pVal standpoint, all being positive, his secondary pitches, the slider, and the curveball are collecting negative values. His changeup is a good offering, but he doesn’t seem to be fooling anyone with the slider and curveball as each has a below-average SwStr%. This is the kind of up-and-down performance we should see from a pitcher who is only 24 years old.