Ottoneu Cold Right Now: August 14th, 2023

Much like Hot Right Now, Cold Right Now will be a weekly Ottoneu feature with a focus on players who are being dropped or who maybe should be dropped in Ottoneu leagues. Hot Right Now will focus on players up for auction, players recently added, and players generally performing well. Cold Right Now will have parallel two of those three sections:
- Injuries: Players who are being cut because of IL stints.
- Roster Cuts: Analysis of players with high cut% changes.
- Cold Performers: Players with a low P/G or P/IP in recent weeks.
There won’t be a corresponding section to Current Auctions because, well, there is nothing in cuts that correspond to current auctions.
Roster Cuts
Bryan Baker, Add% (-) Change (7 days) – 13.74%
Baker’s demotion to AAA mostly seemed like a space-making move to allow Jack Flaherty a roster spot. Baker has been a solid reliever with a 10.93 K/9 and a very small 0.64 HR/9, but a high 5.14 BB/9. Even with that high walk rate (13.7% BB%) Baker’s xERA (3.24) is lower than his actual (3.64). From a pure fantasy production standpoint, however, Baker doesn’t add much to Ottoneu teams. He has recorded no saves and has blown three. He has four wins and 11 holds on the season. It’s highly likely that Baker will return to the O’s bullpen sometime this season and the only reason to add him to fantasy rosters would be for those looking to add wins and holds wherever they can find them.
Scott Barlow, Add% (-) Change (7 days) – 12.46%
Barlow’s actual ERA as a Padre is 11.12 and his FIP is 5.91. That, in part, means that he has been getting somewhat unlucky with balls in play, though he still has given up eight hits, three walks, and a home run in his short stint in San Diego (5.2 IP). Regardless, it wasn’t good for your fantasy team had you been rostering him. If it’s any consolation his worst two appearances as a Padre where he recorded negative points in that format were against the Dodgers. He rebounded with positive points against the Mariners and the Diamondbacks. Either way, lots of fantasy managers are dropping the once-Royals closer because they figure he won’t be recording saves anymore. RosterResource seems to agree, for now, as he’s listed as a middle-reliever. He recorded a hold in his debut with the Padres, but not since.
Luis Severino, Add% (-) Change (7 days) –9.26%
Dan Szymborski recently published “The 2024 Projection Decliners: Pitchers” and Severino was listed as the number two starter. Here’s a snippet from his analysis of Severino:
Sure, the homers will come down, and it’s unlikely Severino will continue to see a BABIP this poor, but there’s no way to explain around a year-over-year loss of about a third of your strikeout rate when combined with a similar ballooning of your walks. This Severino just has too many balls connecting with bats, and it’s hard to get around that.
While some analysts have been relying on the home run rate coming down, Szymborski points out that there is much more than just bad luck happening here:
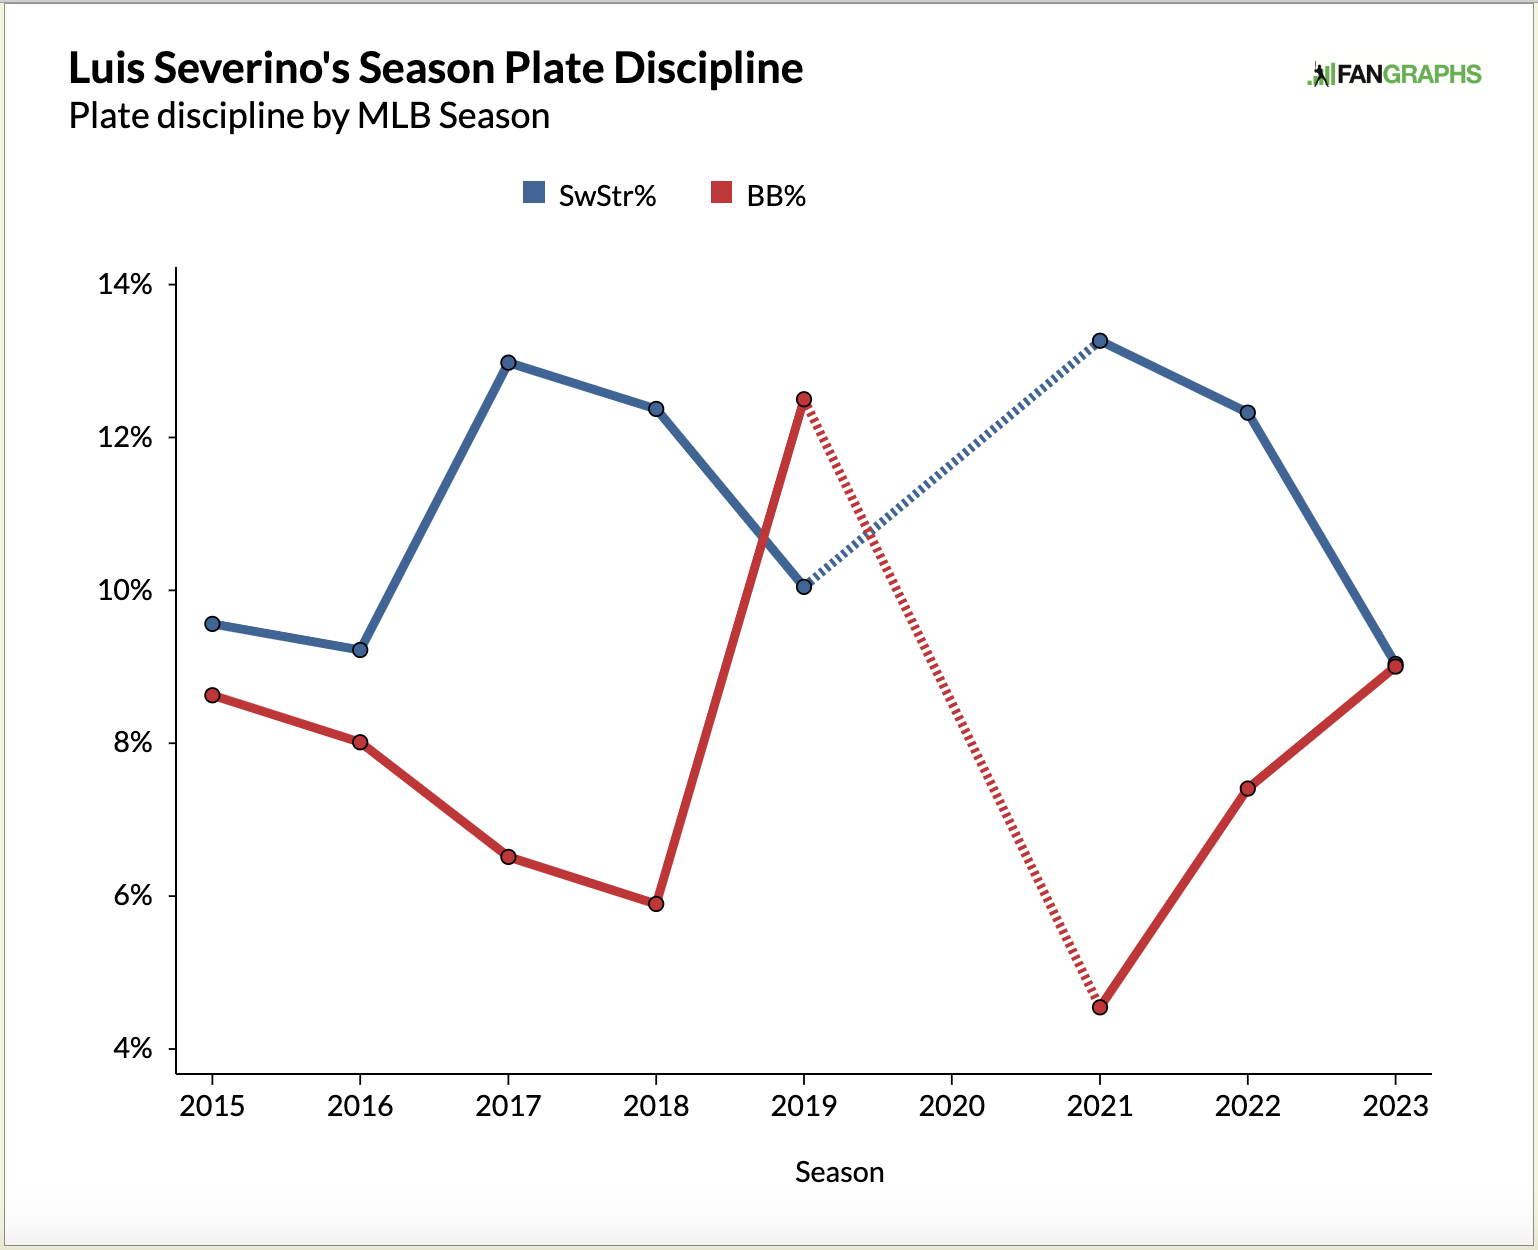
Even if you were to figure his ERA (8.06) and xERA (6.74) are off, you wouldn’t even want to roster the xERA. His swinging strike rate is down, but so is his overall K/9:
2019: 12.75 –> 2021: 12.00 –> 2022: 9.88 –> 2023: 7.92
Starling Marte, Add% (-) Change (7 days) – 8.95%
It was recently reported that Marte won’t be back on the roster when eligible:
Starling Marte (right groin strain) isn't likely to come off the injured list when eligible on Wednesday, per Buck Showalter. Sounds like he may need a minor league rehab assignment, which will extend his absence even further.
Marte hasn't played since Aug. 5.
— Anthony DiComo (@AnthonyDiComo) August 13, 2023
Perhaps some fantasy managers are done waiting around and are in need of the roster spot. While Marte has been disappointing on the base paths this season with 18 stolen bases, that’s still a pretty great mark. Yes, he was projected by most to be in the high twenties and, by some, in the thirties, but injuries happen. His slash line on the year isn’t what it was last year, but it’s still rosterable at .248/.301/.324. Rest of season projections have him for three more home runs and around seven more stolen bases. His wOBA and SLG were declining somewhat before he went on the IL, but it could have been injury related.
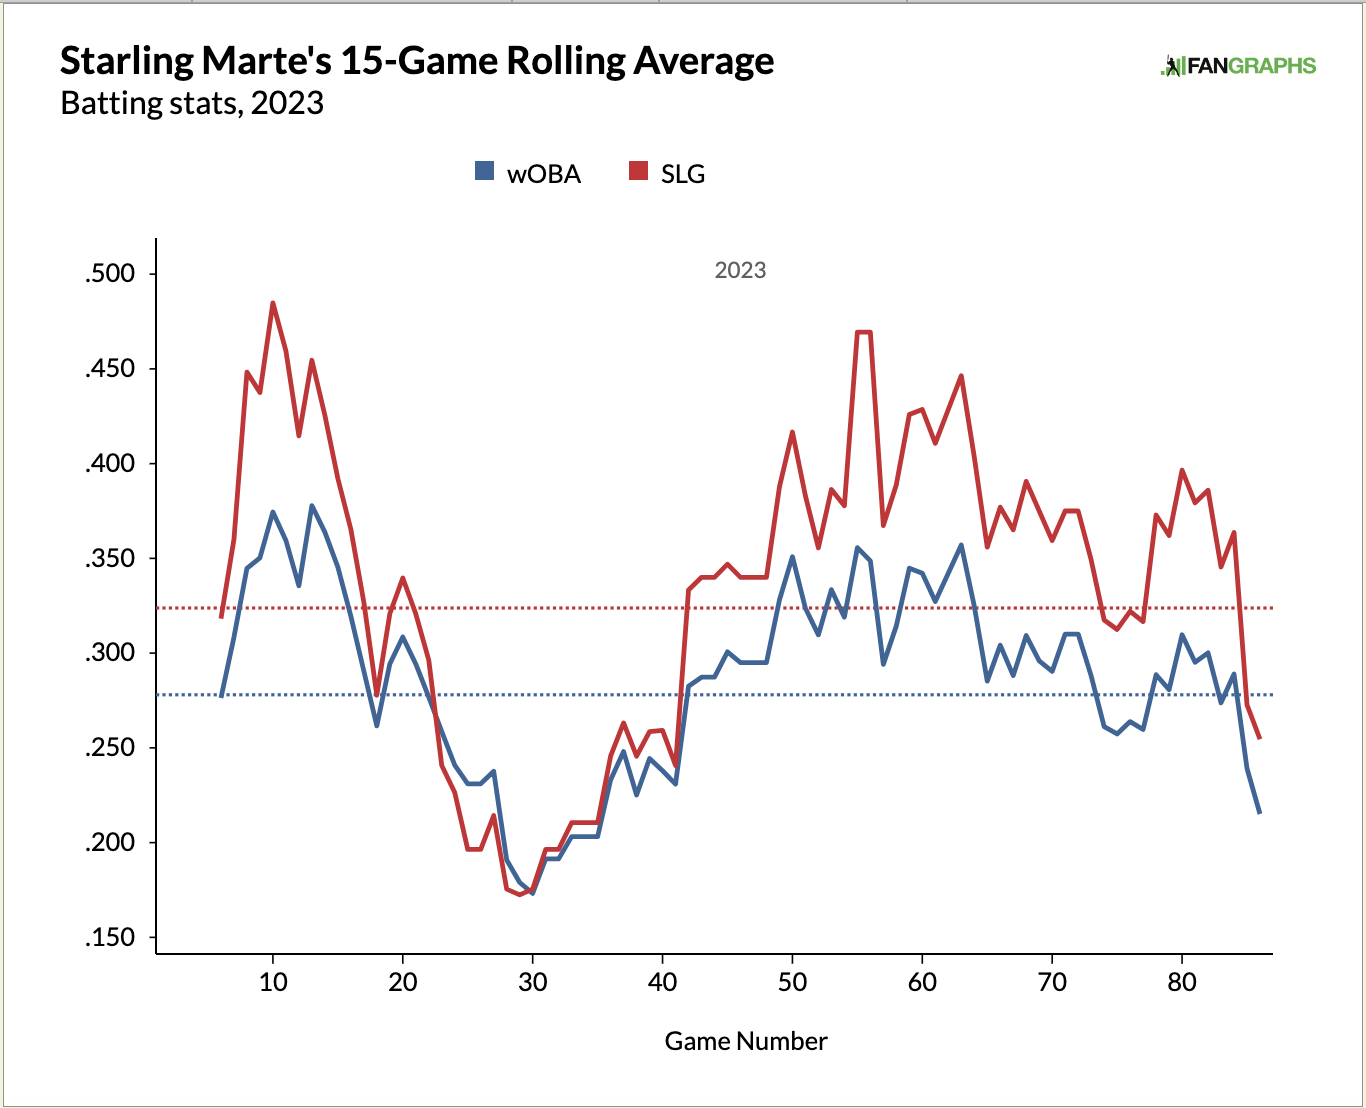
If you’re in a position where you can afford to pick Marte up and you really need stolen bases, he’s not a bad option. Just keep an eye on his performance once he’s back on the field to make sure the injury issues aren’t holding him back.
Matt Manning, Add% (-) Change (7 days) – 7.98%
It has probably been difficult to roster Manning in points formats as he’s given up a lot of home runs in single appearances resulting in three negative point games. But, he’s also hit two games where he’s brought in over 35 points. For the most part, his strike-out numbers are worse than the MLB average, yet his command metrics are better:
| K/9 | K% | SwStr% | |
|---|---|---|---|
| 2023 Manning | 6.14 | 16.3 | 7.2 |
| 2023 SP Average | 8.44 | 22.1 | 10.8 |
–
| BB/9 | BB% | K-BB% | |
|---|---|---|---|
| 2023 Manning | 2.61 | 6.9 | 9.3 |
| 2023 SP Average | 3.00 | 7.8 | 14.2 |
That plays ok in points formats, but not necessarily in standard roto formats. Manning is still only 25 years old and has a median salary only three dollars in Ottonue leagues. If I had him for three dollars or any amount less than that, I’d be keeping him, playing the matchups, and hoping that his player page “Prospect TLDR” eventually rings true:
We’re sticking to our guns regarding Manning’s FV despite a rocky rookie year, due largely to his athleticism and long-term body projection.
Cold Performers
To measure cold performers this week, I’m looking for players with low P/G or P/IP in the last 30 days.
Josh Rojas, -0.22 P/G: Since moving to Seattle Rojas’ slash line has declined .158/.200/.211, though it is the result of only 20 plate appearances. In 2023 with the Diamondbacks, he lost a lot of playing time and recorded only 216 plate appearances. His slash line with the Diamondbacks in 2023 was .228/.292/.296, which is a far cry away from his 2022 .269/.349/.391. He has been batting in the eight and nine spot in the lineup and playing second base with the Mariners.
Austin Hays, 1.32 P/G: Hays’ first-half slash line was excellent (.314/.355/.498) but it has really come down in the second half (.182/.219/.253). A lot of it has to do with an increased ground ball rate (40.6% first half, 58.9% 2nd half) and a decreased BABIP (.389 first half, .236 second half). His 2022 slash line was .250/.306/.413 so we’re really seeing in-season regression to the mean.
Mitch Keller, 1.15 P/IP: Keller’s home run troubles continue to hurt his value in Ottoneu points leagues especially. In his last five starts (26.2 IP) Keller has given up six home runs and twenty earned runs while walking 10. Those are bad numbers. He did strike out 31, but two of those five starts resulted in negative point accumulation in Ottoneu points leagues.
Alex Cobb, 1.79 P/IP: Much like Keller, Cobb has been bit by the home run bug in his last five starts (26 IP) as he gave up seven home runs and 19 earned runs. He also struck out 19 in those starts, but three of the five games resulted in negative point totals.
