
Are There Chronic wOBA Over- and Under-Performers?
You know the third base pool is loaded at the top when there are three players at the position who returned more value than Alex Bregman did in 2019 5×5 Roto leagues. Yet, on draft day 2020, owners are likely to at least consider making the Astros’ 25-year-old the first third baseman taken, ahead of Rafael Devers, Anthony Rendon and Nolan Arenado. To this point, in the currently-under-way Pitcher List Experts Mocks, Bregman is the only third base-eligible player to be taken within the first 14 picks in all three drafts.
It’s not hard to see why. This season, he maintained his elite contact and plate discipline skills while tacking on 10 home runs, nine RBIs and 17 runs to his 2018 totals. In 2020, he would appear to be primed for another batting average around .290, and with a spot in the heart of the Astros’ order, he could clear the hurdles of 110-plus RBIs and runs yet again.
There is just one thing that has me putting the brakes on my own case of Bregmania. His Statcast power indicators are far from elite, and they don’t mesh with my idea of a 40-homer hitter’s profile. In 2019, his average exit velocity on flyballs and line drives was 92.3 mph, which ranked 114th out of 175 hitters who had at least 300 batted balls. His 37.5 percent hard-hit rate and 3.8 percent barrel rate (per plate appearance) were both outside of the top 100 as well.
Some of Bregman’s outsized power production can be chalked up to launch angle, as his 31.5 percent ground ball rate was the eighth-lowest among qualified hitters. Still, it seemed like there must be another explanation for his 41 homers and .296 ISO, and it turns out that there is. Bregman’s .296 Avg exceeded his xBA by 24 points, and his .592 SLG was 121 points higher than his xSLG. Yet I am not quite ready to peg Bregman as a regression candidate. In 2018, there was a similar, though less pronounced, pattern. He outperformed his xBA by 15 points and his xSLG by 64 points.
This, in combination with a similar discovery about Eduardo Escobar, made me wonder if certain players are somehow prone to overachieving their expected stats. I have taken a first pass at addressing this question by regressing the difference between a hitter’s actual wOBA and expected wOBA against the same difference from the previous season. I included all hitters going back to 2015 who had seen at least 2000 pitches in consecutive seasons and wound up with a pool of 322 hitters.
During this period, there has been a statistically significant relationship (R-squared = 0.17, p < .0001) between a hitter’s wOBA – xwOBA from a given season and the same differential from the previous season. The correlation coefficient for the previous season is 0.43, so on one hand, we can expect a hitter’s wOBA – xwOBA differential to regress towards zero the following season. However, a large differential like Bregman’s .049 from this season would typically only shrink by a little more than half. (The constant, incidentally, is less than .0002.)
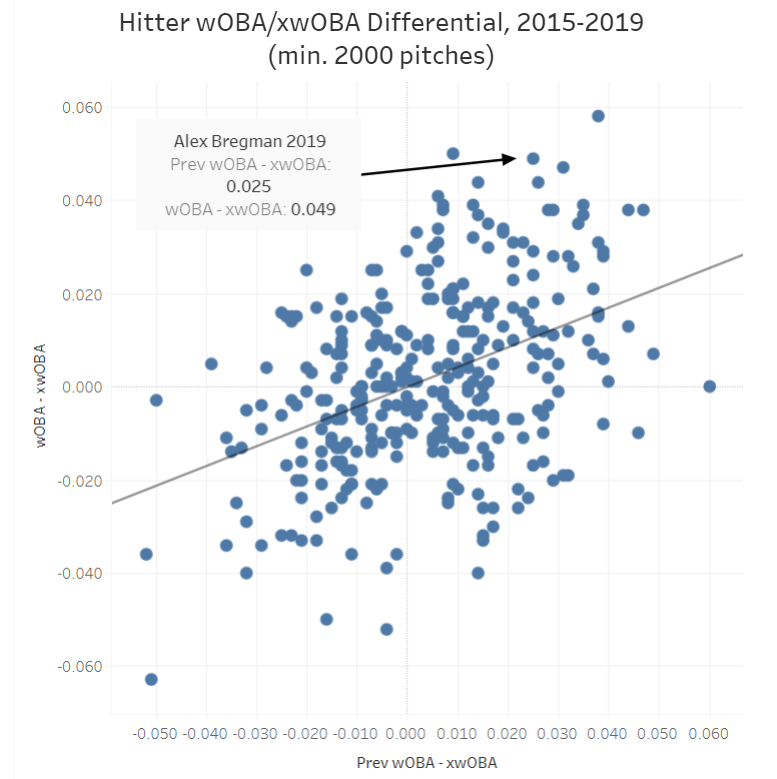
Bregman is not alone in having consecutive seasons with a wOBA that was at least 20 points higher than his xwOBA. Of the 322 hitter seasons included here, 24 of them involved overperforming xwOBA by that magnitude for a second season in a row. However, 14 of those 24 cases represented just five players who had overperformed in at least three consecutive seasons. Charlie Blackmon and Arenado have overperformed their xwOBA by at least 20 points for five seasons running. Trevor Story has been in the same club for the last three seasons. (Noticing a trend yet?) Xander Bogaerts overperformed his xwOBA by at least 20 points in 2015, 2016 and 2017, and Didi Gregorious did the same in 2016, 2017 and 2018.
The Rockies and Red Sox are the teams with the two highest home BABIPs since 2015, as their respective parks have been among the most advantageous for hits in general and for doubles in particular. This creates a common link to connect Blackmon, Arenado, Story and Bogaerts. This explanation leaves Gregorius out, and it also makes it harder to explain how Bregman and Escobar have been able to overachieve their xwOBAs at this level for both 2018 and 2019. Even without a clear explanation, given that Bregman’s wOBA was 49 points above his xwOBA this season, regression may still only take him back to being an overachiever in the 20-to-25 point range in 2020. He has had an xwOBA in the .370s in each of the last two seasons, so he can be drafted with the expectation that he could be close to the .400 mark in 2020. That still renders him worthy of a late first round or early second round pick.
Escobar did not overachieve as dramatically as Bregman in either 2018 or 2019, so while he appears to be a candidate to overachieve in 2020, it may be by roughly 10 points instead of by 24 points, which was the case this season. Jonathan Villar, who overachieved his xwOBA by 27 points this year and by 21 points in 2018, is in a similar position. Both he and Escobar appear to be due for some minor regression. This, of course, does not take into account any changes in productivity that might occur if MLB changes the ball again.
It stands to reason that if there are some repeat overperformers, that there are some repeat underperformers as well. In this pool of hitters, there have been 13 instances of someone underachieving their xwOBA by at least 20 points on multiple occasions. Joe Mauer (2015-18) and Alex Gordon (2016-18) were the only players to do so more than twice. The only hitter to underachieve in both 2018 and 2019 was Marcell Ozuna. His .327 wOBA in 2018 was 32 points short of his xwOBA, while this season’s .340 wOBA was 40 points below his xwOBA. Again, without an explanation, it is hard to know if Ozuna has been incredibly unlucky or if there is some reason why he has fallen well below his xwOBA in successive seasons. The examples of Mauer and Gordon (who underachieved again in 2019, but only by nine points) suggest that there are some players for whom xwOBA may not be a useful indicator of future performance. It is probably safe to say, though, that we should not expect Ozuna to be anywhere close to a .380 wOBA hitter in 2020, just because his profile suggested he should have been one in 2019.
The graph also shows that there have not been many players who substantially overachieved in one season and then substantially underachieved in the following season, and vice versa. Lorenzo Cain overperformed his xwOBA by 17 points in 2018, only to underperform it by 30 points in 2019. Maybe luck, as well as thumb and knee issues, played a role in his subpar performance. Carlos Santana overperformed his xwOBA by 19 points this year after having had underperformed by at least 13 points in each of the previous four seasons. Fantasy owners are probably looking for Santana to regress after he had a career year in his age-33 season, but now we have yet another reason to not expect a repeat of his 2019 season.
Addendum: I did not consider the role that pulled flyball rate could play in wOBA – xwOBA, but fortunately, Jordan Rosenblum has. Check out his excellent work here. His findings go a long way towards explaining the outlier status of Bregman, Escobar, Mauer and Gordon and likely many others.
Al Melchior has been writing about Fantasy baseball and sim games since 2000, and his work has appeared at CBSSports.com, BaseballHQ, Ron Shandler's Baseball Forecaster and FanRagSports. He has also participated in Tout Wars' mixed auction league since 2013. You can follow Al on Twitter @almelchiorbb and find more of his work at almelchior.com.
Doesn’t this suggest the difference has something to do with home park effects that are not adequately addressed? A bunch of Rockies, Bregman loving that Minute Maid LF, Gordon in KC, Mauer in old/new Twins stadium, and Ozuna underperforming (I think St. Louis is bad for righties, right?).
I think it does, but I want to look at that more closely. Also, the differences are impacted by the factors that jarjets89 turned up (see below).
Not to mention Lefty Didi pulling homers in Yankees stadium
Great stuff, we should expect partial but not full regression to xWOBA for a guy like bregman (approximately half way thanks to that tiny constant!). Over at The dynasty guru, I looked at which variables explain xWOBA minus wOBA and found pulled fly balls, oppo fly ball %, shift % , and sprint speed all help explain it (see “potentially ill-advised adventures in xWOBA”)
Appreciate the input, and wish I had come across your findings before I started the analysis!
This, plus limited foul ground has a bigger impact on fly ball hitters (fenway, New York, Houston all have limited foul ground – I think Fenway is #1, plus the wall). Surprised Gordon is on this list as he must be an outlier and Kaufman stadium has a lot of foul ground and is not favorable to hitters generally speaking.
Surprised Castellanos didn’t get a mention, it feels like he’s chronically underperformed his xwOBAs for years now
Good call. He underperformed by > 30 points in 2016 and 2017 and also by 14 points in 2018. Would have gotten a mention if he hit the 20 point cutoff in ’18.
Tiger stadium has 20% more foul ground that NY and Houston and is in the top 3 behind Coors (which is really an anomoly) and Oakland. Plus the unfavorable dimensions and other ballparks quirks it’s not surprising he did so well moving away from DET.
re: Bregman: the pull sides in Minute Maid Park are among the friendliest in baseball in terms of wOBA-xwOBA. It suggests to me Bregman can continue to overperform, but it’s unclear if this excessively high wOBA-xwOBA for HOU is a cause of overperformance or the effect from overperformance (like a causal chicken-and-egg thing). I’m inclined to lean toward the former, but it could be a trap. (Savant query here)
re: Escobar: I’m less sure, but I did make this discovery just the other day where he ranks among the elite in terms of optimizing his launch angle between 26 and 31 degrees, the angles at which barrels are mostly easily achieved (my Tweet here; note that the table in the Tweet spans the entire Statcast era and is not just 2019). Interesting that he is objectively elite in this regard. Theoretically, xwOBA accounts for this, although it neglects spray angle. If he’s optimizing his launch angle exceptionally frequently and being able to turn on pitches, I could see a case made for his continued overperformance.
Really interesting. More data to chew on…thanks, Alex!
In Bregman & Didi’s case, they have been extremely proficient at pulling a high percentage of fly balls to their respective Home park’s short porches. 350 foot fly balls aren’t given much value in terms on xwOBA, but that’s the distance of some of their home runs. Didi isn’t in Bergman’s class in terms of contact & plate approach though.
Ozuna has had poor home parks. Busch isn’t much of an upgrade from Marlins Park if at all due home runs. His batted ball quality was very good. I’d like to see him in a hitters park in 2020
i agree with ozuna, i think hes in a good spot to be profitable next year if he lands in the right spot.
I actually submitted something to this regard as well to the community pages. I found that Statcast undervalues pulled fly balls by an average of 44% and overvalues straightaway fly balls by an average of 43%, when looking at wOBA. It’s also dependent on stadium to some degree. I’ve since looked deeper to add shifting and speed, but that mostly affects ground balls and line drives, and generally for the extremes in those categories.
FWIW, Alex Gordon pulled the ball for only 17.1% of his fly balls in 2019. League average was 25.4% for fly balls. He also plays in a stadium that is one of the worst stadiums for non-pulled fly balls, and plays a lot of his games in a stadium that is brutal for straightaway fly balls (Comerica Park), of which he hits at a league average clip.
Yes ive noticed this with the eye test as well. Didi overperforming just makes sense with his pull fly ball tendencies in such a short RF at YS. I remember Jose Bautista was a big overperformer as well because he LOVED pulling the ball down the line.
Pod had a great xHR formula/piece based on the pull/center/oppo percentages a hitter displayed. Those were quite good before (and still!) statcast really took over.
Linked text doesn’t really show up well in the comments here, I did a table for fly balls and line drives broken down by stadium for ratios for Statcast metrics. It’s here: https://docs.google.com/spreadsheets/d/1uDrv3ds_eUkhGLogKlUaBIIKnQyHHb3F/edit#gid=1680451285
Quick methodology: took ratio of actual metric to xMetric (i.e., BA/xBA) for all balls by home hitters only (in an attempt to mitigate the effects of the same defense being on the field all the time for visitors). Ratios are for the park only, a player who plays in the park for half their games would have a full season ratio of 50% stadium, 50% league average.
This is fantastic. Really helps to explain Bregman, Bogaerts and the COL trio. Thanks for sharing this.
Other guys whose 2019 xwOBA really benefits based on the park only adjustments:
Eugenio Suarez (11.48% of all batted balls are pulled fly balls, nearly twice the league average)
Michael Conforto (9.14% pulled fly balls)
Jose Ramirez (12.08% pulled fly balls, his 10.87% pop up rate doesn’t help)
Yuli Gurriel (pulled fly balls in Minute Maid are gold for a righty, but that unsightly 12.48% pop up rate is troubling)
Cody Bellinger (lots of FB+LD with a league average pop up rate, in a stadium that doesn’t punish straightaway as badly, and greatly rewards lefty pull hitters)
Fantasy-relevant guys whose 2019 xwOBA is hurt by this:
Christian Walker (4.27% pulled fly balls)
Eloy Jimenez (3.27% pulled fly balls)
Jorge Soler (good fly ball pull rate at 7.71%, but 10.84% to straightaway, and plays in a park that is not great for fly balls)
Freddie Freeman (12.29% opposite field fly balls in a stadium that doesn’t perform well for lefties in that regard)
Nelson Cruz (just a little worse that league average in basically all batted ball distributions, if he gets a little slow with the bat, I feel like he could fall off a cliff)
Very cool!
It has been clear for awhile that xwOBA needs both a park adjustment and a speed adjustment and that’s before you even get to things like pulled FB%. Miggy has underperformed his xwOBA by at least 14 points every year of the Statcast era, including 2 years north of 58 points because he is godawful slow and Comerica is a bad park. I know it does OK in ballpark factors, but if you look at hitters there, they all underperform. Castellanos has underperformed every year even though he’s not all that slow. Victor Martinez got crushed every year (another guy whose speed didn’t help). If you look at the TIgers with 100 PA this year, 12 of them underperformed as. 6 who overperformed. Colorado is the opposite – 4 guys underperformed and 10 guys overperformed.
As to speed, you really don’t even need math to know that the same 90 mph ground ball is much more likely to be a hit for Dee Gordon than it is for Kendrys Morales. The defense is playing Gordon on the dirt, maybe even up a bit. Meanwhile, they’re playing Morales 40 feet behind the dirt, That’s a LOT of reaction time in there. Statcast did add a speed component this year, however they only added it on certain hits, primarily topped balls (swinging bunts) which would create an opportunity for beating out a weakly hit ball. But no adjustment for other types of hits even though it is obvious that slow hitters have a huge disadvantage in fielder positioning. I would love to see a chart plotting wOBA-xwOBA against sprint speed.
The issue with sprint speed is it’s also somewhat related to shifting, not because guys that are fast don’t get shifted, but guys who are slow tend to be power guys because they wouldn’t be on the field otherwise, and therefore tend to get shifted more.
214 players hit at least 10 ground balls to the pull side as lefties in 2019. The correlation between shift% and sprint speed for that group is -0.358, which is not crazy high, but it’s not nothing either. You almost have to take them into account in the same group of calculations.
I do agree with your point. Dee Gordon pulled 72 ground balls in 2019. His xBA/xSLG/xwOBA line was .211/.228/.196, while his actual line was .222/.262/.210, which is roughtly 7% higher per wOBA. Kendrys Morales pulled 31 ground balls to his pull side while batting lefty. His xLine was .229/.258/.214, better than Gordon’s actual line. Morales’s actual line was .097/.097/.085, a full 60% worse per wOBA.
Now herein lies the question: is it speed, shifting, or both? Gordon’s sprint speed is 28.5, significantly above league average, while Morales’s is a woeful 23.5. At the same time, Gordon was shifted on 0.14% of his pitches, while Morales was shifted on 64.65% of his pitches from the left side. So is Gordon’s 7% only due to speed, or is there a component in there because he’s not shifted too? And is Morales’s due to his lack of speed or his shifting? And are they related?
Good question that I feel like someone could find an answer to…
Forgot to mention this: I would think shifting and speed each affect the different xStats differently. I would think for line drives, for example, speed would necessarily help with AVG, because whether a line drive is a hit has more to do with where it’s hit in relationship to the fielders. But it might have an effect on SLG and wOBA, since a faster player might be able to sneak an extra base here and there. Same thing for fly balls, but to a lesser degree.
Shifting would likely have an effect on both liners and grounders to the pull side, decreasing all three, but then increasing opposite field line drives and grounders. Furthermore, righties who are fast may get a bump for ground balls to the pull side, since a faster player might be able to beat out more ground balls to the shortstop.
So much to consider…
Savant’s expected stats *do* factor in sprint speed now.
See: https://technology.mlblogs.com/augmenting-statcast-expected-batting-average-with-sprint-speed-6be7f60770d2
Edit: Nevermind, I see you already addressed this
Short porches are xwOBA’s worst nightmare