
An Expansion on xISO, Plus 10 Noteworthy Names
Last week, I introduced xISO, a metric that calculates a player’s expected isolated power based on his batted ball profile (per FanGraphs’ recently added batted ball data courtesy of Baseball Info Solutions). Having looked at a handful of underachieving National League outfielders for its induction, I’ll expand the analysis of xISO here today.
I’ll reiterate some key points. I used all 12 years’ worth of batted ball data for all player-seasons in which a hitter qualified for the batting title. The OLS regression specified pull rate (Pull%), hard-hit rate (Hard%) and fly ball rate (FB%) as explanatory variables and produced the following equation, which I deliberately omitted last week:
xISO = –.1396 + .1814*Pull% + .5136*Hard% + .2344*FB%
Adjusted R-squared: .631
In a perfect world, the explanatory variables would not overlap; or, if they did — and they do — then I would be able to tease out the amount of overlap. However, FanGraphs’ batted ball leaderboard doesn’t dissect the data to that extent*, thus contributing to a degree of multicollinearity (correlation among explanatory variables). The multicollinearity is small, however, and I have tried to quell the principal concerns of overfitting the model or producing biased estimates by keeping the model simple.
*A diligent and curious mind, however, could manipulate the leaderboards using the “splits” dropdown and append multiple data files to manufacture the ideal data set, if he or she so desired.
Moreover, the sabermetric community greatly concerns itself with how quickly statistics stabilize. Unfortunately, I don’t know yet when, by number of plate appearances, xISO becomes reliable. Nor do I know when pull or fly ball rates stabilize, either. Sean Dolinar informed me that hard-hit rate becomes reasonably reliable when a hitter accumulates as few as 70 balls in play, but that denominator does not necessarily hold for the other two rates.
Therefore, it is not yet safe to make inferences based on the following graph alone, which I have generated for the sake of demonstration. Below, I depicted ISO and xISO moving simultaneously for one player-season. I somewhat arbitrarily selected Adam Jones‘ 2014 season, recalling he started off last year rather slowly.
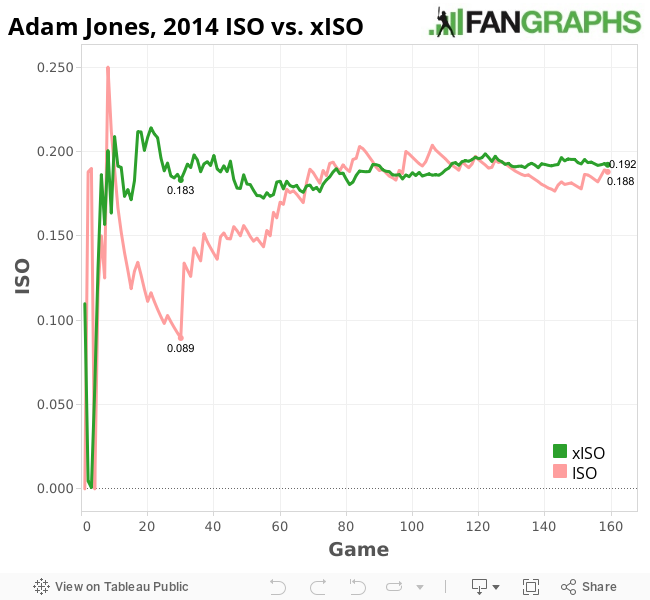
It’s a pleasant coincidence that, by game 159, Jones’ ISO and xISO are almost identical; the end-of-season xISO estimates for everyone else won’t always be so accurate. Regardless, it appears that xISO stabilizes a lot faster than ISO does. (Again, it cannot be stressed enough that, in the instance of Jones, n equals one). Thus, there may be some merit to xISO stabilizing more quickly than ISO. The former, by attributing a certain amount of weight to each input, dampens the effects of sample-size noise in each one. It is also computed based on expected, rather than actual, outcomes; the latter is at the mercy of probabilities.
Please find below a table of the ISOs, xISOs and batted ball information of all 2015 qualified hitters. Underachievers and their varying degrees of underachievement are highlighted in shades of red; overachievers, in blue.
Statistics exclude May 12 games.
Four overachievers, of whom some may be more obvious than others:
Eric Hosmer, KCR 1B
| 2015 | FB% | Pull% | Hard% | ISO | xISO | diff |
|---|---|---|---|---|---|---|
| Eric Hosmer | 27.0% | 34.0% | 27.2% | .222 | .125 | +.097 |
Is this the Hosmer we’ve been waiting for? (Better question: How many times have we asked ourselves that?) The 25-homer pace is pretty, but Hosmer’s .125 xISO almost perfectly aligns with his 2012 and 2014 ISOs (both .127), confirming he’s probably the same, frequently disappointing hitter he has always been.
Stephen Vogt, OAK C
| 2015 | FB% | Pull% | Hard% | ISO | xISO | diff |
|---|---|---|---|---|---|---|
| Stephen Vogt | 39.8% | 49.4% | 36.1% | .316 | .229 | +.087 |
Sure, his hot start is unsustainable, but that’s not what’s peculiar: Vogt’s .229 xISO slots in just below Nelson Cruz, Miguel Cabrera and Justin Upton and just above Jose Bautista. So, again: his hot start is unsustainable. But just because it is unsustainable doesn’t make it illegitimate.
Jake Marisnick, HOU OF
| 2015 | FB% | Pull% | Hard% | ISO | xISO | diff |
|---|---|---|---|---|---|---|
| Jake Marisnick | 32.4% | 35.5% | 25.0% | .198 | .129 | +.069 |
This is a timely development, as David Wiers, in his May tiered rankings of American League outfielders, expressed pessimism regarding Marisnick while I, for reasons not worth trying to articulate, ranked him 1) optimistically, and 2) as a National League outfielder. Anyway, xISO sides with David, and I’m inclined to side with both of them now. Still, the steals are nice. As a slight-power, moderate-speed threat, Marisnick seems like the player, both offensively and defensively, we once wished Adam Eaton would be.
Joey Votto, CIN 1B
| 2015 | FB% | Pull% | Hard% | ISO | xISO | diff |
|---|---|---|---|---|---|---|
| Joey Votto | 26.1% | 45.5% | 33.0% | .235 | .174 | +.061 |
Votto’s 2013 and 2014 xISOs clock in at .185 and .168, respectively, so I have few reasons right now to deny an impending decline from the aging and declining slugger. It’s reasonable to expect the return of 2013 Joey Votto — it’s closer to what his current xISO anticipates than his dreadful 2014 season — but he currently looks like 2011 Joey Votto, and given that RBI are tied to isolated power, those are pretty different Joey Vottos.
Three underachievers, of whom some may be more obvious than others:
Victor Martinez, DET DH
| 2015 | FB% | Pull% | Hard% | ISO | xISO | diff |
|---|---|---|---|---|---|---|
| Victor Martinez | 37.4% | 38.5% | 28.6% | .061 | .165 | -.104 |
V-Mart’s struggles are well-chronicled, and it’s not the first time he has been slow out the gate following an injury. If one harkens back to 2013, one may recall an incredibly slow start before ravaging the league for the latter half of the year. The .165 xISO is a far cry from last year’s .230 ISO, but it points to a more promising rest of season.
Danny Santana, MIN SS
| 2015 | FB% | Pull% | Hard% | ISO | xISO | diff |
|---|---|---|---|---|---|---|
| Danny Santana | 26.0% | 38.1% | 34.5% | .071 | .168 | -.097 |
The plate discipline is horrid, but xISO still thinks Santana is due for more power given how hard he has hit the ball this season. His batting average and lack of power would be tolerable were he running, but he’s not, so they’re not. An interesting buy-low in deeper leagues, perhaps.
Troy Tulowitzki, COL SS
| 2015 | FB% | Pull% | Hard% | ISO | xISO | diff |
|---|---|---|---|---|---|---|
| Troy Tulowitzki | 36.7% | 54.4% | 45.6% | .188 | .279 | -.091 |
Tulo is straight-up hitting the snot out of the ball when he makes contact, sporting an xISO that mirrors last year’s .263 ISO amid a half-season in which he simply punished opposing pitchers. A straightforward metric such as HR/FB would scream regression right now, so this one isn’t so bold. Also, there was a pretty strong caveat in when he makes contact: he’s striking out at a career-worst rate and walking at an astonishingly bad 1.9-percent clip. Sorry, OBP!
Four dudes who are performing exactly how one might expect them to perform, so that’s interesting, man:
Carlos Gonzalez, COL OF
| 2015 | FB% | Pull% | Hard% | ISO | xISO | diff |
|---|---|---|---|---|---|---|
| Carlos Gonzalez | 27.1% | 31.4% | 27.1% | .120 | .120 | +.000 |
It’s just ugly at this point. It’s easy to convince oneself to wait for CarGo, a perennial all-star, to come around and bust his funk. xISO, quite definitively, denounces such patience as unwise. I encourage you to get as big a return as you can for him, and to do it sooner rather than later.
Chris Davis, BAL 1B
| 2015 | FB% | Pull% | Hard% | ISO | xISO | diff |
|---|---|---|---|---|---|---|
| Chris Davis | 40.0% | 60.0% | 40.0% | .271 | .268 | +.003 |
Crush is back. (Mostly.) The xISO splits the difference between his ridiculous 2013 and miserable 2014 — right where most of us probably thought he’d be.
Mookie Betts, BOS OF
| 2015 | FB% | Pull% | Hard% | ISO | xISO | diff |
|---|---|---|---|---|---|---|
| Mookie Betts | 45.5% | 40.7% | 31.0% | .194 | .200 | -.006 |
The kid’s a monster. He has already outdone himself, and it all seems legit.
Alex Rodriguez, NYY DH
| 2015 | FB% | Pull% | Hard% | ISO | xISO | diff |
|---|---|---|---|---|---|---|
| Alex Rodriguez | 42.3% | 43.6% | 47.4% | .308 | .282 | +.026 |
I’ll let you make sense of this on your own. We all cope in different ways.
Dare I ask: could A-Rod actually produce enough value this year to justify his salary? (Not his entire salary, obviously — just this year’s.)
Very interesting article. Looking through the list of names, I see that Chris Carter is on the wrong side of the ISO curve so far. With his overall struggles so far this year, I am looking at bringing in another 1st Baseman who I can plug into my line up until Carter can (hopefully) pull out this funk enough to be decent.
A name not listed here, but that I am interested in grabbing is Brandon Belt. I know the power may never fully develop, but he has been thoroughly unproductive in virtually ever category not named Batting Average so far. He seems to be hitting better in May, but do we see SOME power coming from Belt where I could plug him into the hole I have at First right now or should I keep looking at the Wire for guys like Logan Morrison, Kyle Blanks or Ryan Howard (ugh)?
Belt’s xISO is .215, so he’s “due” for a surge. He’s just not hitting many fly balls, though. He would be worth grabbing to capture his impending hot streak, but I’d rather have Blanks or Howard (almost interchangeable to me) long-term.
Good stuff Alex.
I own Hosmer in a fantasy league at a holdover price so decided to take a closer look at him. All by eye test only as I was a little interested in his spray chart as I’d heard he was hitting home runs mostly center and left of center field. Again eye test only but looking at the spray chart it sure looks as if he hits the ball harder when going the other way. And by harder I simply mean it looks like more line drives and home runs. And he hits more ground balls when he pulls the ball. I know eye test and small sample and all, but do you see it? And could there be anything to this? your data is based completely on pulling the ball. I am very interested in hearing your feedback on this.
Thanks
Yes, you are right. He’s hitting hard-hit balls to the opposite field at a career-high rate, so there could be some validity to him defying his xISO projection. Good catch!
(For some reason, Oppo% is negatively correlated with ISO, so that’s why I exclude it from the model. However, capturing hard-hit rate to the opposite field would be a helpful addition. It’s on my to-do list!)
Thanks Alex,
It wasn’t a good catch. As I said, I own him in a league. So when the announcers had said something about it I wondered when I saw your article. Because as you know, we have a heavy stake in the players we own. Ha!
Thanks again for the reply. Btw, It seems as if he had more Oppo power in 2013? when he had his semi-breakout with home runs.
It’s hard to say — can’t tell from the data where his oppo FBs and LDs intersect with his hard-hit FBs and LDs. One thing he definitely did in 2013, however: he pulled his fly balls. Only 3.6 percent of his fly balls have been hit to the pull side this year, waaaay down from years’ past. Think that might have something to do with his weak power projection.
Nice article.
One question though, you said that RBI are tied to .ISO (Joey Votto section). Can you elaborate on this (or someone else)?
To my knowledge this is how you calculate .ISO –> SLG – AVG and Extra bases / AB.
Maybe I’ve been watching baseball wrong all these years, but to my eye RBI is tied to guys getting on base ahead of you. I didn’t realize that was a skill Votto had, but maybe he’s able to distract the pitcher while in the on-deck circle, leading to more walks by whoever is batting ahead of him?
Well, of course they’re associated. Let’s imagine a hypothetical world in which nobody ever gets on base in front of Giancarlo Stanton, and nobody ever gets on base in front of Ben Revere. Who will get more RBIs? Stanton or Revere? Of course it will be Stanton because Stanton hits homers. Now let’s imagine that only runners with average speed and on first base are on in front of both. Stanton will have more RBI because he hits homers and doubles, Revere will get very few because nobody scores on his singles. Of course ISO is associated with RBI.
What Corey said. I didn’t mean to imply that ISO and RBI are explicitly functions of each other, but they are correlated in that a player who hits more extra-base hits will more often score the runners who are on base. A double, for example, can occasionally score a runner from first, whereas a single sometimes can’t even score a runner from second.
Great article. Good to see Tulos homers should rebound and confirmation that Crush is back.
Not so good news on Cargo though, cant say I didnt expect it!
Literally every player on my roster has a higher xISO than ISO.
So does this mean that Frazier’s HR output at this point is pretty legit? His ISO is way above previous seasons.
Not sure how one would go about finding this out, but at what point (noted above 70 balls hit in play) would you presume a guy is just lost at the plate and you can give up on him or if he is just unlucky/not doing well at this point in time? Ian Desmond for example… Career low in FB% and hard%… would he be a good guy to buy low on right now (like one would think) or is he actually just struggling at the plate and not connecting with the ball and more likely in line for a down year (maybe injured or something wrong with his swing?)?
Any thoughts?
btw great article
He might be a little bit lost; his swing rate on pitches outside the zone is currently a career-worst. But he’s also making his most contact since 2012, and his plate discipline is consistent with years past. Although Hard% is reliable, it’s still not super reliable at this point in the season, so I think he’s a legitimate buy-low target.
Thanks for the feedback…
Superimposed trendlines! Alex, you’re freaking awesome.
(For everyone else: no, I’m not being sarcastic. This article just flat out rocks.)
Vogt has pulled 75% of his fly-balls this year..FYI
I enjoyed this article quite a bit and it got me thinking about how xISO could be used in conjunction with the rest-of-season projections from the Depth Charts (a combination of ZiPS and Steamer). To check this out, I took the spreadsheet from this article and added in a column for the Depth Charts rest-of-season projections. I also added in the pre-season projected ISO for each player to see how much has changed in a month. Then I compared each player’s current ISO with his projected ISO (using the Depth Charts). The result was a spreadsheet I could use to look at each player in some different ways.
Here are some of the players mentioned in the article:
Eric Hosmer
.222—Current ISO
.125—xISO
+.097—Difference (ISO-xISO)
.155—Pre-season Depth Charts ISO
.164—Depth Charts RoS ISO
If you trust projections, you would already be expecting Hosmer to drop from his current ISO. When you add in the information that his xISO is almost 100 points below his current ISO and well below his projected ISO, it becomes even more likely that he’ll drop from such great heights (yes, an Eternal Sunshine of the Spotless Mind reference, for those scoring at home).
Stephen Vogt
.316—Current ISO
.229—xISO
+.087—Difference (ISO-xISO)
.143—Pre-season Depth Charts ISO
.167—Depth Charts RoS ISO
Vogt is a bit different. Looking at projections, you would expect a drop, but with his xISO being above his projected ISO, maybe he won’t drop as far as you might think. His terrific start has bumped up his projected rest-of-season ISO by .024 since the pre-season.
Jake Marisnick
.198—Current ISO
.129—xISO
+.069—Difference (ISO-xISO)
.124—Pre-season Depth Charts ISO
.132—Depth Charts RoS ISO
With Jake Marisnick, his xISO and the Depth Charts RoS projections are in agreement—he should be about a .130 ISO guy, not the .198 he’s posted so far. Come on down, Jake Marisnick!
Joey Votto
.235—Current ISO
.174—xISO
+.061—Difference (ISO-xISO)
.188—Pre-season Depth Charts ISO
.196—Depth Charts RoS ISO
Votto is above what you might expect based on xISO but with a RoS projection that is .022 higher than his xISO, perhaps he’s not playing too far over his head.
Victor Martinez
.061—Current ISO
.165—xISO
-.104—Difference (ISO-xISO)
.173—Pre-season Depth Charts ISO
.163—Depth Charts RoS ISO
Victor Martinez’ xISO and Depth Charts RoS ISO are almost exactly the same. He’s the opposite of Jake Marisnick. Rise and shine, Victor Martinez!
Troy Tulowitzki
.188—Current ISO
.279—xISO
-.091—Difference (ISO-xISO)
.232—Pre-season Depth Charts ISO
.223—Depth Charts RoS ISO
Tulo is underperforming based on xISO but to a much less extent than his Depth Charts RoS projections would suggest. He could meet somewhere in between his current ISO and his xISO.
Mookie Betts
.194—Current ISO
.200—xISO
-.006—Difference (ISO-xISO)
.142—Pre-season Depth Charts ISO
.148—Depth Charts RoS ISO
Betts has been better than his projected ISO and his production nearly matches his xISO, so he could be someone who will outhit his projections.
Alex Rodriguez
.308—Current ISO
.282—xISO
+.026—Difference (ISO-xISO)
.155—Pre-season Depth Charts ISO
.178—Depth Charts RoS ISO
The projections have bumped A-Rod up .023 points of ISO looking forward but his xISO is expecting even more than his RoS projections.
And then there’s Pedro Alvarez. I thought he was interesting simply because he is really not at all interesting. He’s exactly who we thought he was:
Pedro Alvarez
.208—Current ISO
.207—xISO
+.001—Difference (ISO-xISO)
.206—Pre-season Depth Charts ISO
.207—ZiPS RoS ISO
.207—Steamer RoS ISO
.207—Depth Charts RoS ISO
.201—Career ISO
You just keep being you, Pedro Alvarez.
This is great! It’ll be interesting to see how xISO compares to Steamer/ZiPS RoS ISO for Hosmer, Vogt, Tulo and Betts.
Did you look at including height, weight and/or home park factors in the model? I assume they would add at least some explanatory power.
No. This is a pretty simple model. I’m inclined to agree with that assumption.
Any idea when/if xISO will be available on player profiles or when we can add it to our Stats Customizer?
That’s up to David Appelman. I haven’t brought it up to him — no idea it would have this kind of demand. I would like to refine it a bit first if anything. I wouldn’t count on it being available this year, but I’ll refresh the list with a new post every now and then.
Awesome, thank you