Adjusting Projection Analysis to League Run Scoring Environment
The following analysis is beyond nerdy.
I’ll try to keep it simple as possible, but no guarantees. This past week, I examined the results of several hitter projection systems. In the comments of the first article, Mays Copeland and Skin Blues brought up a near 15-year-old thread on the InsideTheBook blog between Tom Tango and Nate Silver.
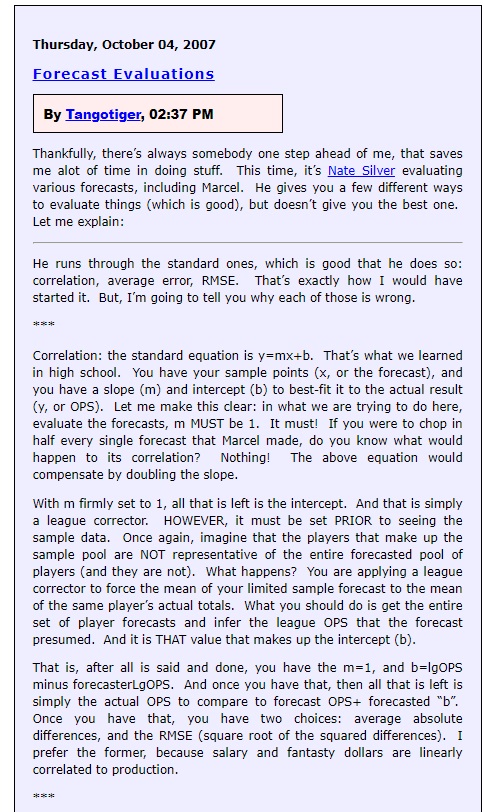
Tom stated that to evaluate projection accuracy, the values need to be adjusted to the league average. Then he spells out how to do it.
Nate Silver agrees that for rate stats, it’s best to adjust but comes back with a stipulation boxed in red.
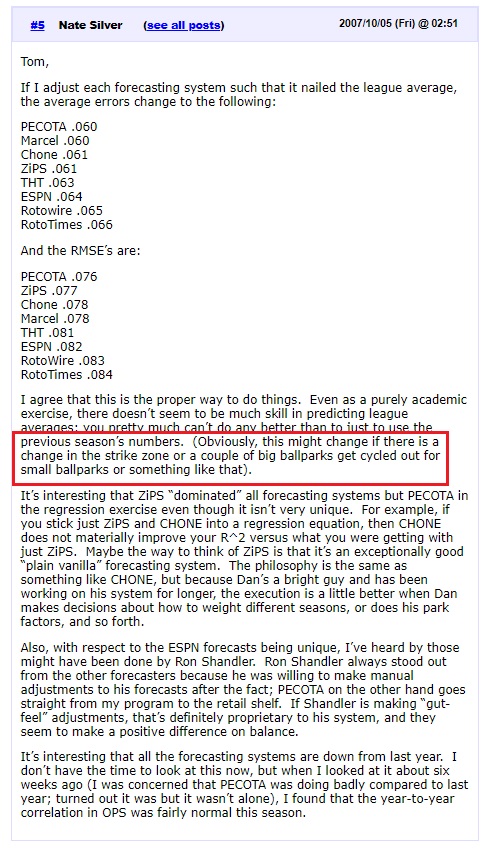
The ever-changing baseball over the last few seasons definitely falls under the “or something like that”. But that’s not all. When fantasy managers go into the season, some of us use a system to convert projections into an overall 5×5 roto value. Most of those systems are based on the previous season or a few seasons of standing results. So, does it matter if a projection system correctly guesses the run-scoring environment? Even when I explained the concept to my co-author, Tanner Bell, I got the, “I’ll have to think about that” (i.e. hopefully Jeff’s just drunk and will forget about this conversation).
Here is an example of why I think it matters. I understand I could be wrong, but for the two people still reading, please let me know.
Assume the following player would perform differently depending on how juiced is the ball. This hitter is in the sweet spot where his production can vary quite a bit. Some sluggers will just clear the fence with any ball. Some rabbits on the other hand won’t have the strength to hit any ball out.
| Type of Ball | PA | AB | H | R | HR | RBI | SB | BA | BB% |
|---|---|---|---|---|---|---|---|---|---|
| Juiced | 600 | 540 | 162 | 120 | 36 | 120 | 10 | .300 | 10% |
| Normal | 600 | 540 | 162 | 100 | 30 | 100 | 10 | .300 | 10% |
| Soft | 600 | 540 | 162 | 80 | 24 | 80 | 10 | .300 | 10% |
I did was increased or decreased his Runs, RBI, and Home Runs by 20%. Now assume a fantasy manager projected the middle stat to use in a 15-team NFBC league. In the 2021 Edition of The Process, Tanner Bell and I worked through setting up a Standings Gained formula for 2021. We ended up with:
SGP = R/13.8+HR/5.6+RBI/14.2+SB/4.3+((1733+H)/(6665+AB)-.2595)/.012
The following table applies the formula the above hitter
| Type of Ball | R | HR | RBI | SB | AVG | Total | % from SB & AVG |
|---|---|---|---|---|---|---|---|
| Juiced | 8.7 | 6.4 | 8.5 | 2.3 | 2.9 | 28.8 | 18.2% |
| Normal | 7.2 | 5.3 | 7.1 | 2.3 | 2.9 | 24.9 | 21.1% |
| Soft | 5.8 | 4.3 | 5.6 | 2.3 | 2.9 | 20.9 | 25.0% |
Depending on the type of ball used, where his profile provides value changes. If the ball softens up, his manager will be disappointed with the number of Runs, RBI, and Home Runs accumulated.
What this last exercise shows that guesstimating the correct run environment to pair with how the projections generate values could be key to extracting any value.
I went back to the home run projection and found how the projected home run environment compared to the actual one.
| Projection | HR/PA | HR/600 PA | Diff from Actual |
|---|---|---|---|
| Actual | 0.0354 | 21.2 | 100.0% |
| PECOTA | 0.0364 | 21.8 | 102.8% |
| Davenport | 0.0366 | 21.9 | 103.4% |
| Bat | 0.0367 | 22.0 | 103.8% |
| BatX | 0.0367 | 22.0 | 103.9% |
| Average | 0.0375 | 22.5 | 106.0% |
| Mastersball | 0.0375 | 22.5 | 106.1% |
| ZiPS | 0.0376 | 22.5 | 106.2% |
| Pods | 0.0377 | 22.6 | 106.5% |
| ATC | 0.0377 | 22.6 | 106.6% |
| DepthCharts | 0.0378 | 22.7 | 106.9% |
| Steamer | 0.0379 | 22.7 | 107.1% |
| Razzball | 0.0381 | 22.9 | 107.7% |
| Rotowire | 0.0384 | 23.1 | 108.6% |
| Paywall #1 | 0.0385 | 23.1 | 108.9% |
A near 10% range of production existed with a huge jump from the BatX to Mastersball. This quick analysis leads to two more questions. How does the RSME value compare if the stats are adjusted to the league? Also, how does the difference compare across different projections and stats?
First, here are the five stats with their original RSME and being adjusted to the league scoring environment, with the Average always coming out on top with the Bats, ATC, and Depth Charts each having a nice showing.
| Projection | RMSE | Projection | Adj RMSE |
|---|---|---|---|
| BatX | 0.0124 | Average | 0.0118 |
| Bat | 0.0128 | BatX | 0.0123 |
| Average | 0.0129 | ATC | 0.0126 |
| ATC | 0.0129 | Razzball | 0.0127 |
| Steamer | 0.0130 | Bat | 0.0127 |
| DepthCharts | 0.0131 | DepthCharts | 0.0127 |
| Razzball | 0.0131 | Steamer | 0.0128 |
| PECOTA | 0.0132 | Zips | 0.0130 |
| Zips | 0.0134 | PECOTA | 0.0131 |
| Zola | 0.0136 | Zola | 0.0133 |
| Pods | 0.0136 | Pods | 0.0133 |
| Davenport | 0.0138 | Rotowire | 0.0134 |
| Rotowire | 0.0140 | Davenport | 0.0137 |
| Paywall #1 | 0.0145 | Paywall #1 | 0.0139 |
| Projection | Act RMSE | Projection | Adj RMSE |
|---|---|---|---|
| BatX | 0.0219 | Average | 0.0204 |
| Bat | 0.0220 | BatX | 0.0217 |
| DepthCharts | 0.0222 | Bat | 0.0218 |
| Steamer | 0.0225 | DepthCharts | 0.0221 |
| Pods | 0.0226 | ATC | 0.0223 |
| Average | 0.0226 | Steamer | 0.0224 |
| ATC | 0.0229 | Pods | 0.0225 |
| ZiPS | 0.0232 | ZiPS | 0.0228 |
| Razzball | 0.0239 | Razzball | 0.0234 |
| PECOTA | 0.0249 | Zola | 0.0235 |
| Zola | 0.0250 | PECOTA | 0.0240 |
| Paywall #1 | 0.0264 | Paywall #1 | 0.0244 |
| Davenport | 0.0271 | Rotowire | 0.0255 |
| Rotowire | 0.0285 | Davenport | 0.0265 |
| Projection | Act RMSE | Projection | Adj RMSE |
|---|---|---|---|
| BatX | 0.0254 | Average | 0.0241 |
| Bat | 0.0256 | BatX | 0.0253 |
| ATC | 0.0265 | Bat | 0.0255 |
| Average | 0.0267 | ATC | 0.0259 |
| PECOTA | 0.0272 | Steamer | 0.0266 |
| Pods | 0.0272 | PECOTA | 0.0267 |
| Steamer | 0.0273 | Pods | 0.0269 |
| Razzball | 0.0287 | DepthCharts | 0.0270 |
| Zola | 0.0288 | Razzball | 0.0277 |
| DepthCharts | 0.0290 | Zola | 0.0283 |
| Paywall #1 | 0.0292 | Paywall #1 | 0.0283 |
| Rotowire | 0.0310 | Rotowire | 0.0293 |
| Davenport | 0.0322 | ZiPS | 0.0295 |
| ZiPS | 0.0334 | Davenport | 0.0316 |
| Projection | Act RMSE | Projection | Adj RMSE |
|---|---|---|---|
| BatX | 0.0085 | Average | 0.0080 |
| Bat | 0.0085 | BatX | 0.0085 |
| Average | 0.0086 | Bat | 0.0085 |
| ATC | 0.0087 | ATC | 0.0086 |
| DepthCharts | 0.0088 | DepthCharts | 0.0087 |
| Steamer | 0.0089 | ZiPS | 0.0088 |
| Razzball | 0.0089 | Rotowire | 0.0089 |
| Pods | 0.0090 | Steamer | 0.0090 |
| ZiPS | 0.0092 | Pods | 0.0090 |
| Rotowire | 0.0092 | Razzball | 0.0090 |
| Paywall #1 | 0.0096 | Paywall #1 | 0.0092 |
| Davenport | 0.0097 | Davenport | 0.0096 |
| Mastersball | 0.0105 | Mastersball | 0.0096 |
| PECOTA | 0.0107 | PECOTA | 0.0109 |
| Projection | Act RMSE | Projection | Adj RMSE |
|---|---|---|---|
| Bat | 0.0338 | Average | 0.0313 |
| BatX | 0.0340 | Bat | 0.0332 |
| PECOTA | 0.0341 | BatX | 0.0335 |
| DepthCharts | 0.0343 | DepthCharts | 0.0335 |
| Razzball | 0.0343 | ZiPS | 0.0338 |
| Steamer | 0.0346 | ATC | 0.0339 |
| Average | 0.0346 | Steamer | 0.0340 |
| ZiPS | 0.0348 | PECOTA | 0.0341 |
| ATC | 0.0349 | Razzball | 0.0341 |
| Pods | 0.0358 | Pods | 0.0344 |
| Davenport | 0.0370 | Mastersball | 0.0346 |
| Mastersball | 0.0371 | Paywall #1 | 0.0350 |
| Paywall #1 | 0.0374 | Davenport | 0.0359 |
| Rotowire | 0.0395 | Rotowire | 0.0368 |
Overall, the projection league adjustment changes the projections just a bit with the Average now dominating all categories.
Here is a look at how the projections estimated the run-scoring environment. First, here are the raw values for reference with the percentages following.
| Projection | HR/PA | Runs/PA | RBI/PA | SB/PA | AVG | HR*600PA | Runs*600PA | RBI*600PA | SB*600PA |
|---|---|---|---|---|---|---|---|---|---|
| Actual | 0.035 | 0.125 | 0.120 | 0.013 | .250 | 21.2 | 74.9 | 72.2 | 7.8 |
| ATC | 0.038 | 0.130 | 0.126 | 0.014 | .258 | 22.6 | 77.8 | 75.4 | 8.3 |
| Average | 0.038 | 0.130 | 0.126 | 0.014 | .258 | 22.5 | 77.8 | 75.6 | 8.3 |
| Bat | 0.037 | 0.128 | 0.123 | 0.013 | .256 | 22.0 | 76.8 | 73.6 | 7.9 |
| BatX | 0.037 | 0.128 | 0.123 | 0.013 | .256 | 22.0 | 76.8 | 73.5 | 7.9 |
| Davenport | 0.037 | 0.129 | 0.124 | 0.014 | .259 | 21.9 | 77.3 | 74.3 | 8.2 |
| DepthCharts | 0.038 | 0.127 | 0.130 | 0.015 | .257 | 22.7 | 76.4 | 77.9 | 8.8 |
| Mastersball | 0.038 | 0.133 | 0.125 | 0.016 | .263 | 22.5 | 79.6 | 74.8 | 9.5 |
| Paywall #1 | 0.039 | 0.134 | 0.126 | 0.015 | .263 | 23.1 | 80.2 | 75.6 | 8.9 |
| PECOTA | 0.036 | 0.131 | 0.125 | 0.011 | .249 | 21.8 | 78.5 | 75.1 | 6.6 |
| Pods | 0.038 | 0.127 | 0.124 | 0.012 | .260 | 22.6 | 76.1 | 74.4 | 7.0 |
| Razzball | 0.038 | 0.129 | 0.127 | 0.014 | .254 | 22.9 | 77.3 | 76.1 | 8.5 |
| Rotowire | 0.038 | 0.136 | 0.128 | 0.014 | .264 | 23.1 | 81.7 | 77.0 | 8.4 |
| Steamer | 0.038 | 0.126 | 0.126 | 0.014 | .256 | 22.7 | 75.8 | 75.7 | 8.5 |
| ZiPS | 0.038 | 0.129 | 0.133 | 0.015 | .258 | 22.5 | 77.1 | 80.0 | 9.1 |
| Projection | HR | Runs | RBI | SB | AVG | Avg of 5 | StdDev | Off Avg of 4 | StdDev |
|---|---|---|---|---|---|---|---|---|---|
| Actual | 100.0% | 100.0% | 100.0% | 100.0% | 100.0% | 100.0% | 0.0% | 100.0% | 0.0% |
| BatX | 103.9% | 102.6% | 101.8% | 101.0% | 102.4% | 103.2% | 1.1% | 102.7% | 0.9% |
| Bat | 103.8% | 102.6% | 101.9% | 101.0% | 102.5% | 103.2% | 1.0% | 102.7% | 0.8% |
| PECOTA | 102.8% | 104.9% | 104.0% | 84.8% | 99.8% | 103.8% | 8.3% | 102.9% | 2.2% |
| Davenport | 103.4% | 103.3% | 102.9% | 104.7% | 103.6% | 103.3% | 0.7% | 103.3% | 0.3% |
| Pods | 106.5% | 101.6% | 103.0% | 89.0% | 103.9% | 104.1% | 6.8% | 103.8% | 2.1% |
| Steamer | 107.1% | 101.2% | 104.9% | 108.6% | 102.5% | 104.2% | 3.1% | 103.9% | 2.6% |
| Razzball | 107.7% | 103.2% | 105.4% | 108.2% | 101.6% | 105.4% | 2.8% | 104.5% | 2.7% |
| Average | 106.0% | 103.9% | 104.8% | 105.7% | 103.2% | 105.0% | 1.2% | 104.5% | 1.2% |
| ATC | 106.6% | 104.0% | 104.4% | 106.7% | 103.4% | 105.3% | 1.5% | 104.6% | 1.4% |
| DepthCharts | 106.9% | 102.1% | 107.9% | 112.4% | 102.9% | 104.5% | 4.2% | 104.9% | 2.9% |
| MastersBall | 106.1% | 106.3% | 103.7% | 121.4% | 105.3% | 106.2% | 7.3% | 105.3% | 1.2% |
| ZiPS | 106.2% | 103.0% | 110.8% | 115.9% | 103.3% | 104.6% | 5.5% | 105.8% | 3.6% |
| Paywall #1 | 108.9% | 107.1% | 104.7% | 114.1% | 105.1% | 108.0% | 3.8% | 106.5% | 2.0% |
| Rotowire | 108.6% | 109.2% | 106.6% | 106.8% | 105.5% | 108.9% | 1.5% | 107.5% | 1.7% |
Of the four hitting categories, only PECOTA’s batting average didn’t over project. This is not a surprise with the league run scoring down the same amount. ZiPS was the only projection that had a standard deviation over 3% for the differences in the four offensive categories. The Bat’s and the Average posted small standard deviations on the four and when paired with their previous results, they stand out.
With stolen bases, Pods and PECOTA were the only two to under projected, but as a whole everyone was way too optimistic. When it comes to stolen bases, the two Bat’s dominate with the Average holding their own.
So getting back to the original question, of needing to adjust the projection for the league average, I think performing the analysis is the “right” answer looking back even though the result might not change. There was a major change in the projected run-scoring environment, but each of the four offensive categories missed by generally the same amount. I’m not sure if this will always be the case. Also, the results were clean since stolen bases were, on a whole, also over projected. Everything was headed in the same direction this past season with the Average of all five categories over projected by 5% with a range of 3.2% to 6.0%.
One step I’ll likely add in the preseason is to compare the projections coming into the season and point out any discrepancies. Otherwise, I’ll just add a few steps to my future analysis.
Jeff, one of the authors of the fantasy baseball guide,The Process, writes for RotoGraphs, The Hardball Times, Rotowire, Baseball America, and BaseballHQ. He has been nominated for two SABR Analytics Research Award for Contemporary Analysis and won it in 2013 in tandem with Bill Petti. He has won four FSWA Awards including on for his Mining the News series. He's won Tout Wars three times, LABR twice, and got his first NFBC Main Event win in 2021. Follow him on Twitter @jeffwzimmerman.
Jeff, this is wonderful. Thank you for taking the time to re-run the numbers; I think these are much clearer.
Your SGP concern is valid, too, I think. That could be a reason why you want projections that come closest to predicting the league average.