A Simple Fix for Barrels in 2021
Here is a disputed fact: MLB changed the ball. League brass, on the record, wanted to make the ball livelier but also raise the height of the seams, which would increase drag. The two changes — more bounce, but also more air resistance — would, more or less, offset each other.
The fact is disputed because some of the game’s most intelligent minds — namely, renowned baseball physicists, the very people most capable of determining if the ball is, indeed, different — doubt the ball has changed. It’s imperative I tell you this because they may be right, which would make me (and MLB, for the umpteenth time), well, wrong. Everything that follows assumes the ball has changed. Maybe this meshes with what you’ve witnessed, maybe it doesn’t. This is simply one stupid man’s interpretation of the data available to us thus far.
Early returns suggest MLB accomplished what it set out to accomplish. We can use weighted on-base average on contact (wOBAcon) to describe hitter production on balls in play, aka batted ball events (BBE). The average hitter is slightly less productive in 2021 than in past years, but not egregiously so, as shown below. Also, it’s only April; as the weather warms, so should be the bats. It’s reasonable to expect 2021’s league-wide wOBAcon value to climb a few ticks before year’s end.
| Year | wOBAcon |
|---|---|
| 2015 | 0.361 |
| 2016 | 0.369 |
| 2017 | 0.373 |
| 2018 | 0.368 |
| 2019 | 0.378 |
| 2020 | 0.375 |
| 2021 | 0.364 |
In short, to the naked, unskeptical eye, hardly anything has changed. But the clothed, skeptical eye of the typical FanGraphs reader — and certainly of a fantasy player who routinely uses Statcast data and leverages advanced analytics to their advantage — may have noticed other collateral damage: every hitter and his mother set a personal record for maximum exit velocity (max EV), including the GOAT, Mike Trout. Giancarlo Stanton seems to set and promptly re-set some kind of league-wide exit velocity (EV) record with each passing game.
Statcast purveys a series of metrics the community fondly calls “xStats,” headlined by its expected wOBA (xwOBA) metric. xStats are intended to describe the performance a hitter (or pitcher) deserved based on the outcomes we’ve already observed. When isolated to only BBE, xwOBA becomes xwOBAcon and allows the user to compare a hitter’s actual production (wOBAcon) to his deserved production (xwOBAcon). They can be powerful (albeit misused) tools in one’s tool belt.
The table below shows the difference between wOBAcon and xwOBAcon by year. One of these things is not like the others.
| Year | wOBAcon – xwOBAcon |
|---|---|
| 2015 | +0.014 |
| 2016 | +0.012 |
| 2017 | +0.008 |
| 2018 | +0.006 |
| 2019 | +0.006 |
| 2020 | -0.003 |
| 2021 | -0.029 |
But the weather! Yes, cold April weather should affect production. So, I compared wOBAcon and xwOBAcon through May 1 of each year. This provides more of an apples-to-apples comparison, whereas the previous table compared only April of 2021 to the entireties of previous years, which included their warm summers. Suddenly, wOBAcon trails xwOBAcon — this is what the weather argument would have posited to begin with — but still by only a fraction of the margin that it does in 2021.
| Year | wOBAcon – xwOBAcon |
|---|---|
| 2015 | +0.014 |
| 2016 | -0.003 |
| 2017 | -0.009 |
| 2018 | -0.011 |
| 2019 | -0.009 |
| 2020 | n/a |
| 2021 | -0.029 |
The Statcast team has dealt with this issue every year. Each season begets a new run-scoring environment, yet Statcast’s xStats are predicated upon the run-scoring environment of previous seasons. Only until the current season has terminated, or is at least sufficiently far-enough along, can the Statcast folks recalibrate their models. It is what it is.
That, until further notice, still leaves us fantasy nerds in a bind. The margin between actual and deserved production is about 30 points of wOBAcon. However, we cannot, should not, simply subtract 30 points from each hitter’s deserved outcomes to make it match his actuals. The bouncier ball and the increased drag affects batted balls differently. Ground ball hitters (or even line drive hitters) might be affected less by the new ball than fly ball hitters.
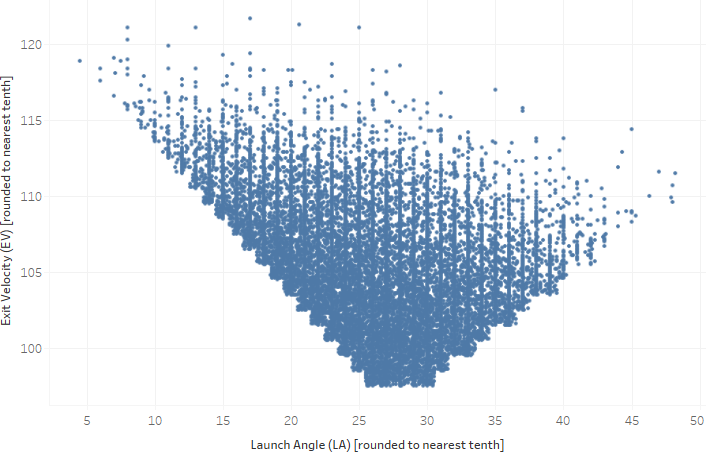
I am not equipped with the requisite intellect, skills, or time to refine xwOBAcon and make it usable for the masses. However, I am equipped with just enough of these traits to refine barrel percentage, a Statcast metric that calculates the frequency with which a batter hits a well-struck ball at an optimal launch angle. Barrels are consistently highly productive, and their frequency correlates strongly with both actual and deserved hitter production.
Barrels rely on a baseline EV threshold — 97.5 miles per hour, if I’m not mistaken. I outline the process for calculating barrels here; the farther a batted ball strays from a range of optimal launch angles, the more EV is required to make the batted ball productive.
Unfortunately, this baseline EV loses its meaning if the ball cultivates “harder” hits simply by being bouncier. For the first time during the Statcast era, batted balls with EVs of 98 mph or greater comprise more than 5% of all pitches — and that’s all while hitters are striking out at a historically high clip. It leaves us with this conundrum: for the first time during the Statcast era, an increase in barrels does not coincide with an increase in hitter productivity. Barrel rate and wOBAcon through April 30 of each year, to control (however crudely) for those dastardly weather-related effects:
| Year | wOBAcon | Barrel% |
|---|---|---|
| 2015 | 0.350 | 5.0% |
| 2016 | 0.360 | 6.7% |
| 2017 | 0.360 | 6.7% |
| 2018 | 0.364 | 7.8% |
| 2019 | 0.369 | 8.0% |
| 2020 | n/a | n/a |
| 2021 | 0.364 | 8.5% |
The trendline is obvious. The two metrics increase in lockstep until 2021 when they diverge. Thanks to the ball being bouncier, “hard” hits are coming more cheaply than ever — yet the higher seams, causing more drag, are suppressing the efficacy of these “hard” hits. Predictably, production specifically on barrels has taken a hit, too, trailing prior Statcast-era seasons by anywhere from 50 to 150 points of wOBAcon.
I propose a simple, temporary fix: increase the minimum EV threshold, and all other dynamic calculations therein, just one mile per hour, from 97.5 mph to 98.5 mph:
if EV < 98.5 mph, then barrel = no
if LA > 25.5° and LA < 30.5°, then barrel = yes
if LA < 25.5° and (25.5 – LA) < (EV – 98.5), then barrel = yes
if LA > 30.5° and ((LA – 30.5) * 2) < ((EV – 98.5) * 3), then barrel = yes
if EV > 98.5 mph but none of these apply, then barrel = no
This change to the algorithm increases league-wide wOBAcon on barrels by 50 points and reduces barrel rate by 1.3%, making both nearly identical to the offensive context we witnessed in 2018 (which also featured an overall wOBAcon of 0.364):
2018: 7.8% barrels, 1.375 wOBAcon on barrels
2021 before: 8.5% barrels, 1.321 wOBAcon on barrels
2021 after: 7.8% barrels, 1.379 wOBAcon on barrels
It’s a small change, but it should now permit us to compare barrel rate year over to year to assess who has actually improved rather than be duped by increased EVs across baseball.
The table below shows, for all hitters with at least 40 BBE through April 30, hitters’ barrel rates before and after the change, sorted by who it impacted most. I can’t afford to update this table routinely, so I will add it to the ‘BBE’ tab of my Pitch Leaderboard, where this “new” barrel rate will replace the original, until further notice. (The “new” barrel rate will go live later today, so if you click through right after this was published, it might not be ready yet.)
Enjoy!
| Hitter Name | BBE | Old Barrel% | New Barrel% | Change |
|---|---|---|---|---|
| Matt Chapman | 54 | 14.8% | 9.3% | -5.6% |
| Tyler Naquin | 45 | 17.8% | 13.3% | -4.4% |
| Franmil Reyes | 54 | 24.1% | 20.4% | -3.7% |
| Colin Moran | 58 | 12.1% | 8.6% | -3.4% |
| Shohei Ohtani | 61 | 24.6% | 21.3% | -3.3% |
| Randal Grichuk | 63 | 11.1% | 7.9% | -3.2% |
| Nick Solak | 65 | 15.4% | 12.3% | -3.1% |
| Rhys Hoskins | 66 | 18.2% | 15.2% | -3.0% |
| Rafael Devers | 69 | 21.7% | 18.8% | -2.9% |
| Cesar Hernandez | 69 | 8.7% | 5.8% | -2.9% |
| Ryan McMahon | 74 | 10.8% | 8.1% | -2.7% |
| Xander Bogaerts | 75 | 10.7% | 8.0% | -2.7% |
| David Peralta | 78 | 9.0% | 6.4% | -2.6% |
| Brandon Nimmo | 40 | 7.5% | 5.0% | -2.5% |
| Jose Adolis Garcia | 42 | 21.4% | 19.0% | -2.4% |
| Brandon Belt | 42 | 19.0% | 16.7% | -2.4% |
| Keston Hiura | 42 | 11.9% | 9.5% | -2.4% |
| Luis Urias | 42 | 11.9% | 9.5% | -2.4% |
| Zach McKinstry | 41 | 9.8% | 7.3% | -2.4% |
| Leury Garcia | 42 | 4.8% | 2.4% | -2.4% |
| Fernando Tatis Jr. | 44 | 22.7% | 20.5% | -2.3% |
| Juan Soto | 44 | 18.2% | 15.9% | -2.3% |
| Francisco Mejia | 44 | 6.8% | 4.5% | -2.3% |
| Mitch Moreland | 43 | 4.7% | 2.3% | -2.3% |
| Pete Alonso | 45 | 20.0% | 17.8% | -2.2% |
| Rowdy Tellez | 45 | 13.3% | 11.1% | -2.2% |
| Adam Duvall | 48 | 12.5% | 10.4% | -2.1% |
| Byron Buxton | 50 | 24.0% | 22.0% | -2.0% |
| Yordan Alvarez | 51 | 11.8% | 9.8% | -2.0% |
| Alex Dickerson | 50 | 10.0% | 8.0% | -2.0% |
| Jonathan India | 50 | 10.0% | 8.0% | -2.0% |
| Mike Yastrzemski | 50 | 10.0% | 8.0% | -2.0% |
| Brandon Crawford | 52 | 13.5% | 11.5% | -1.9% |
| Wil Myers | 54 | 13.0% | 11.1% | -1.9% |
| Tommy Pham | 52 | 11.5% | 9.6% | -1.9% |
| Lourdes Gurriel | 54 | 7.4% | 5.6% | -1.9% |
| Tommy La Stella | 54 | 7.4% | 5.6% | -1.9% |
| Willson Contreras | 55 | 14.5% | 12.7% | -1.8% |
| Brandon Lowe | 57 | 14.0% | 12.3% | -1.8% |
| Paul DeJong | 55 | 12.7% | 10.9% | -1.8% |
| C.J. Cron | 57 | 12.3% | 10.5% | -1.8% |
| Travis d’Arnaud | 57 | 10.5% | 8.8% | -1.8% |
| Omar Narvaez | 57 | 8.8% | 7.0% | -1.8% |
| Jonathan Schoop | 56 | 7.1% | 5.4% | -1.8% |
| Yoan Moncada | 58 | 10.3% | 8.6% | -1.7% |
| Asdrubal Cabrera | 59 | 8.5% | 6.8% | -1.7% |
| Charlie Blackmon | 59 | 8.5% | 6.8% | -1.7% |
| Kris Bryant | 63 | 12.7% | 11.1% | -1.6% |
| Vladimir Guerrero Jr. | 63 | 12.7% | 11.1% | -1.6% |
| Ramon Laureano | 64 | 12.5% | 10.9% | -1.6% |
| Giovanny Urshela | 62 | 8.1% | 6.5% | -1.6% |
| Joey Wendle | 63 | 4.8% | 3.2% | -1.6% |
| Luis Arraez | 64 | 3.1% | 1.6% | -1.6% |
| Alec Bohm | 67 | 10.4% | 9.0% | -1.5% |
| Marcell Ozuna | 68 | 8.8% | 7.4% | -1.5% |
| Mookie Betts | 67 | 4.5% | 3.0% | -1.5% |
| Jed Lowrie | 72 | 9.7% | 8.3% | -1.4% |
| Anthony Rizzo | 74 | 8.1% | 6.8% | -1.4% |
| Paul Goldschmidt | 73 | 8.2% | 6.8% | -1.4% |
| Gleyber Torres | 72 | 4.2% | 2.8% | -1.4% |
| Jose Ramirez | 76 | 13.2% | 11.8% | -1.3% |
| Nolan Arenado | 78 | 9.0% | 7.7% | -1.3% |
| Jake Cronenworth | 79 | 5.1% | 3.8% | -1.3% |
| Corey Seager | 81 | 11.1% | 9.9% | -1.2% |
| Whit Merrifield | 86 | 3.5% | 2.3% | -1.2% |
| Bryce Harper | 59 | 22.0% | 22.0% | 0.0% |
| Mike Trout | 47 | 21.3% | 21.3% | 0.0% |
| Nelson Cruz | 61 | 21.3% | 21.3% | 0.0% |
| Jazz Chisholm | 45 | 20.0% | 20.0% | 0.0% |
| Evan Longoria | 47 | 19.1% | 19.1% | 0.0% |
| Javier Baez | 47 | 19.1% | 19.1% | 0.0% |
| Aaron Judge | 53 | 18.9% | 18.9% | 0.0% |
| Jesse Winker | 59 | 18.6% | 18.6% | 0.0% |
| Matt Olson | 66 | 18.2% | 18.2% | 0.0% |
| Ronald Acuna | 72 | 18.1% | 18.1% | 0.0% |
| Carson Kelly | 40 | 17.5% | 17.5% | 0.0% |
| Bobby Dalbec | 42 | 16.7% | 16.7% | 0.0% |
| Kyle Seager | 78 | 16.7% | 16.7% | 0.0% |
| Will Smith | 47 | 14.9% | 14.9% | 0.0% |
| Chris Taylor | 54 | 14.8% | 14.8% | 0.0% |
| Giancarlo Stanton | 61 | 14.8% | 14.8% | 0.0% |
| Bo Bichette | 64 | 14.1% | 14.1% | 0.0% |
| Gregory Polanco | 43 | 14.0% | 14.0% | 0.0% |
| J.T. Realmuto | 57 | 14.0% | 14.0% | 0.0% |
| Yadier Molina | 51 | 13.7% | 13.7% | 0.0% |
| Willy Adames | 52 | 13.5% | 13.5% | 0.0% |
| Nathaniel Lowe | 67 | 13.4% | 13.4% | 0.0% |
| J.D. Martinez | 68 | 13.2% | 13.2% | 0.0% |
| Salvador Perez | 68 | 13.2% | 13.2% | 0.0% |
| Dominic Smith | 46 | 13.0% | 13.0% | 0.0% |
| Avisail Garcia | 55 | 12.7% | 12.7% | 0.0% |
| Joey Votto | 71 | 12.7% | 12.7% | 0.0% |
| Justin Turner | 71 | 12.7% | 12.7% | 0.0% |
| Trey Mancini | 71 | 12.7% | 12.7% | 0.0% |
| Wilson Ramos | 63 | 12.7% | 12.7% | 0.0% |
| Mark Canha | 65 | 12.3% | 12.3% | 0.0% |
| Jorge Soler | 49 | 12.2% | 12.2% | 0.0% |
| Yermin Mercedes | 67 | 11.9% | 11.9% | 0.0% |
| Carlos Santana | 68 | 11.8% | 11.8% | 0.0% |
| Eduardo Escobar | 76 | 11.8% | 11.8% | 0.0% |
| Eugenio Suarez | 51 | 11.8% | 11.8% | 0.0% |
| Justin Upton | 51 | 11.8% | 11.8% | 0.0% |
| Mitch Haniger | 76 | 11.8% | 11.8% | 0.0% |
| Austin Meadows | 60 | 11.7% | 11.7% | 0.0% |
| Jared Walsh | 61 | 11.5% | 11.5% | 0.0% |
| Trea Turner | 61 | 11.5% | 11.5% | 0.0% |
| Luis Robert | 62 | 11.3% | 11.3% | 0.0% |
| Ty France | 71 | 11.3% | 11.3% | 0.0% |
| Brian Anderson | 45 | 11.1% | 11.1% | 0.0% |
| Nicholas Castellanos | 72 | 11.1% | 11.1% | 0.0% |
| David Bote | 46 | 10.9% | 10.9% | 0.0% |
| Hunter Dozier | 46 | 10.9% | 10.9% | 0.0% |
| Freddie Freeman | 74 | 10.8% | 10.8% | 0.0% |
| Buster Posey | 47 | 10.6% | 10.6% | 0.0% |
| Kyle Tucker | 76 | 10.5% | 10.5% | 0.0% |
| Ryan Mountcastle | 58 | 10.3% | 10.3% | 0.0% |
| Aledmys Diaz | 41 | 9.8% | 9.8% | 0.0% |
| Yasmani Grandal | 41 | 9.8% | 9.8% | 0.0% |
| Trevor Story | 72 | 9.7% | 9.7% | 0.0% |
| Anthony Santander | 42 | 9.5% | 9.5% | 0.0% |
| Jose Altuve | 53 | 9.4% | 9.4% | 0.0% |
| Pavin Smith | 64 | 9.4% | 9.4% | 0.0% |
| Billy McKinney | 43 | 9.3% | 9.3% | 0.0% |
| Michael Taylor | 54 | 9.3% | 9.3% | 0.0% |
| Marcus Semien | 65 | 9.2% | 9.2% | 0.0% |
| Bryan Reynolds | 66 | 9.1% | 9.1% | 0.0% |
| Manny Machado | 77 | 9.1% | 9.1% | 0.0% |
| Robbie Grossman | 55 | 9.1% | 9.1% | 0.0% |
| Starling Marte | 44 | 9.1% | 9.1% | 0.0% |
| Ian Happ | 45 | 8.9% | 8.9% | 0.0% |
| Jacob Stallings | 45 | 8.9% | 8.9% | 0.0% |
| Josh Naylor | 56 | 8.9% | 8.9% | 0.0% |
| Michael Conforto | 45 | 8.9% | 8.9% | 0.0% |
| Aaron Hicks | 57 | 8.8% | 8.8% | 0.0% |
| Max Muncy | 57 | 8.8% | 8.8% | 0.0% |
| Travis Shaw | 57 | 8.8% | 8.8% | 0.0% |
| Albert Pujols | 59 | 8.5% | 8.5% | 0.0% |
| Trent Grisham | 47 | 8.5% | 8.5% | 0.0% |
| Dylan Carlson | 61 | 8.2% | 8.2% | 0.0% |
| Erik Gonzalez | 61 | 8.2% | 8.2% | 0.0% |
| Phillip Evans | 61 | 8.2% | 8.2% | 0.0% |
| Dansby Swanson | 62 | 8.1% | 8.1% | 0.0% |
| Enrique Hernandez | 77 | 7.8% | 7.8% | 0.0% |
| Jose Abreu | 64 | 7.8% | 7.8% | 0.0% |
| Yulieski Gurriel | 79 | 7.6% | 7.6% | 0.0% |
| Clint Frazier | 40 | 7.5% | 7.5% | 0.0% |
| Rougned Odor | 40 | 7.5% | 7.5% | 0.0% |
| Garrett Cooper | 42 | 7.1% | 7.1% | 0.0% |
| Michael Brantley | 70 | 7.1% | 7.1% | 0.0% |
| Ozzie Albies | 70 | 7.1% | 7.1% | 0.0% |
| Gary Sanchez | 43 | 7.0% | 7.0% | 0.0% |
| Luis Torrens | 43 | 7.0% | 7.0% | 0.0% |
| Tim Anderson | 43 | 7.0% | 7.0% | 0.0% |
| Alex Verdugo | 74 | 6.8% | 6.8% | 0.0% |
| David Dahl | 59 | 6.8% | 6.8% | 0.0% |
| Austin Slater | 45 | 6.7% | 6.7% | 0.0% |
| Carlos Correa | 80 | 6.3% | 6.3% | 0.0% |
| Adam Eaton | 65 | 6.2% | 6.2% | 0.0% |
| Jeff McNeil | 49 | 6.1% | 6.1% | 0.0% |
| Eddie Rosario | 68 | 5.9% | 5.9% | 0.0% |
| Jean Segura | 51 | 5.9% | 5.9% | 0.0% |
| Jesus Aguilar | 68 | 5.9% | 5.9% | 0.0% |
| Willians Astudillo | 52 | 5.8% | 5.8% | 0.0% |
| Jose Trevino | 53 | 5.7% | 5.7% | 0.0% |
| Austin Riley | 54 | 5.6% | 5.6% | 0.0% |
| Freddy Galvis | 54 | 5.6% | 5.6% | 0.0% |
| Nick Senzel | 54 | 5.6% | 5.6% | 0.0% |
| Maikel Franco | 74 | 5.4% | 5.4% | 0.0% |
| Jason Heyward | 58 | 5.2% | 5.2% | 0.0% |
| Alex Bregman | 59 | 5.1% | 5.1% | 0.0% |
| Randy Arozarena | 59 | 5.1% | 5.1% | 0.0% |
| Donovan Solano | 40 | 5.0% | 5.0% | 0.0% |
| Manuel Margot | 60 | 5.0% | 5.0% | 0.0% |
| Hunter Renfroe | 42 | 4.8% | 4.8% | 0.0% |
| Joey Gallo | 42 | 4.8% | 4.8% | 0.0% |
| Yandy Diaz | 62 | 4.8% | 4.8% | 0.0% |
| Garrett Hampson | 65 | 4.6% | 4.6% | 0.0% |
| Starlin Castro | 65 | 4.6% | 4.6% | 0.0% |
| A.J. Pollock | 47 | 4.3% | 4.3% | 0.0% |
| Jorge Polanco | 70 | 4.3% | 4.3% | 0.0% |
| Yonathan Daza | 46 | 4.3% | 4.3% | 0.0% |
| Jose Iglesias | 75 | 4.0% | 4.0% | 0.0% |
| Cedric Mullins | 77 | 3.9% | 3.9% | 0.0% |
| Andrew Benintendi | 57 | 3.5% | 3.5% | 0.0% |
| Corey Dickerson | 59 | 3.4% | 3.4% | 0.0% |
| Isiah Kiner-Falefa | 87 | 3.4% | 3.4% | 0.0% |
| Didi Gregorius | 63 | 3.2% | 3.2% | 0.0% |
| Willi Castro | 63 | 3.2% | 3.2% | 0.0% |
| Christian Vazquez | 64 | 3.1% | 3.1% | 0.0% |
| Jeimer Candelario | 72 | 2.8% | 2.8% | 0.0% |
| Raimel Tapia | 74 | 2.7% | 2.7% | 0.0% |
| DJ LeMahieu | 76 | 2.6% | 2.6% | 0.0% |
| Tim Locastro | 40 | 2.5% | 2.5% | 0.0% |
| Yoshitomo Tsutsugo | 40 | 2.5% | 2.5% | 0.0% |
| Eric Hosmer | 83 | 2.4% | 2.4% | 0.0% |
| Cavan Biggio | 43 | 2.3% | 2.3% | 0.0% |
| Josh Harrison | 44 | 2.3% | 2.3% | 0.0% |
| Nick Ahmed | 46 | 2.2% | 2.2% | 0.0% |
| Pedro Severino | 45 | 2.2% | 2.2% | 0.0% |
| Victor Robles | 46 | 2.2% | 2.2% | 0.0% |
| Amed Rosario | 51 | 2.0% | 2.0% | 0.0% |
| Evan White | 50 | 2.0% | 2.0% | 0.0% |
| Wilmer Flores | 50 | 2.0% | 2.0% | 0.0% |
| Andrew McCutchen | 52 | 1.9% | 1.9% | 0.0% |
| Jackie Bradley Jr. | 57 | 1.8% | 1.8% | 0.0% |
| Marwin Gonzalez | 55 | 1.8% | 1.8% | 0.0% |
| Francisco Lindor | 61 | 1.6% | 1.6% | 0.0% |
| Elvis Andrus | 66 | 1.5% | 1.5% | 0.0% |
| Miguel Rojas | 68 | 1.5% | 1.5% | 0.0% |
| Kevin Newman | 74 | 1.4% | 1.4% | 0.0% |
| Tommy Edman | 91 | 1.1% | 1.1% | 0.0% |
| Adam Frazier | 82 | 0.0% | 0.0% | 0.0% |
| David Fletcher | 92 | 0.0% | 0.0% | 0.0% |
| Hanser Alberto | 43 | 0.0% | 0.0% | 0.0% |
| J.P. Crawford | 68 | 0.0% | 0.0% | 0.0% |
| Josh Fuentes | 53 | 0.0% | 0.0% | 0.0% |
| Jurickson Profar | 68 | 0.0% | 0.0% | 0.0% |
| Myles Straw | 65 | 0.0% | 0.0% | 0.0% |
| Nick Madrigal | 70 | 0.0% | 0.0% | 0.0% |
| Nicky Lopez | 60 | 0.0% | 0.0% | 0.0% |
(Default sort: “Difference” ascending, “New Barrel%” descending)
Every batter wants to increase their hard hit rate but also reduce their ground ball numbers. So why not use bats with a larger diameter but, and this is the important part, saw off the lower third of the bat? Better to swing and whiff than hit into a double play.
I think that I am on to something here; way to improve the game without changing the design of the ball.
Larger diameter bats mean less backspin imparted on the ball when you get under it. So even if you kept the cross-sectional area the same as a regular bat but cut out the bottom portion, you may reduce the distance traveled by fly balls.
On the other hand, you could keep the bat diameter the same, but still cut that bottom portion. Then you wouldn’t have reduced distance on the fly balls. But it’s not obvious to me that converting ground balls into whiffs would improve hitter performance either. A soft ground ball doesn’t have a high expected average, but increasing the number of strikes in the count by 1 also has a negative effect. So I doubt it would be beneficial, but that’s just my gut.