2022 Ottoneu Arbitration League and Team Data
Arbitration wrapped up Monday and before we move onto trade season (though some of you already have), it’s worth looking back at what happened in arbitration and what we can learn from it.
For this article, I limited myself to only leagues that are Ottoneu Prestige League-eligible, meaning they have no unique economic rules and have exactly 12 teams. I also removed any leagues that did not complete arbitration. Who does and does not do their allocations is not random (more engaged managers are more likely to complete arbitration) so keeping those leagues in would skew the data.
League Level Data
All teams must receive a minimum of $11 in arbitration ($1 from each other team in their league) and a maximum of $33 ($3 from each other team). In practice, only two leagues actually used this full range, primarily because only two leagues had a team receive only $11. While 52 teams had at least one team receive $33, only 42 leagues had a team receive $15 or less. At the other end of the spectrum, two leagues tied for the “smallest range” as both had a range of $9 (both from $20-$29).
For anyone who has gone through this process before, this is not a huge surprise. Most teams, in most leagues, are either a) good teams that competed and therefore deserve allocations or b) bad teams that rebuilt and have some good value players who deserve arbitration. As a result, allocations tend to skew towards the high end of the range, with relatively few teams left at the bottom. You can see that on this histogram below:

The average league had a $16 range, from about $16 on the low end to about $32 on the high end.
Of the 52 leagues that had at least one team receive the full $33, nine leagues handed out the full $33 to multiple teams – seven leagues gave it to two teams; two leagues gave it to three teams.
Team Level Data
The biggest question on team-level data is “what teams get hit with the most arbitration.” And the first data point isn’t a huge surprise:
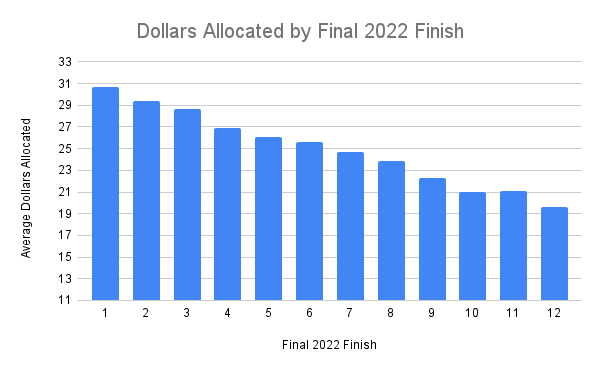
Not surprisingly, teams allocate a lot of dollars to the teams that win. In fact, based on the R-squared between standings place and dollars allocated to a team, about 46% of how much a team gets in arbitration can be explained by where they finished in the just-ended season. Every spot you move up costs you, on average, about $1.
One theory bandied about on Ottoneu Slack was that the order teams are listed on the arbitration menu might have an impact. When a manager goes to make their allocations, the teams are listed in order of their Ottoneu team ID number, which is effectively the order the team (not the manager) joined the league. Managers speculated that being at the top or the bottom of that list might lead to bigger or smaller allocations – maybe managers allocate a lot early and then run short later and tighten the pursestrings? Or maybe they are cautious early and then dump whatever is left at the end?
The R-squared for the relationship between menu order and dollars allocated per team is extremely low: .0015. This suggests there is basically no relationship between menu order and dollars allocated. But looking at a bar chart like the one above calls that into question:
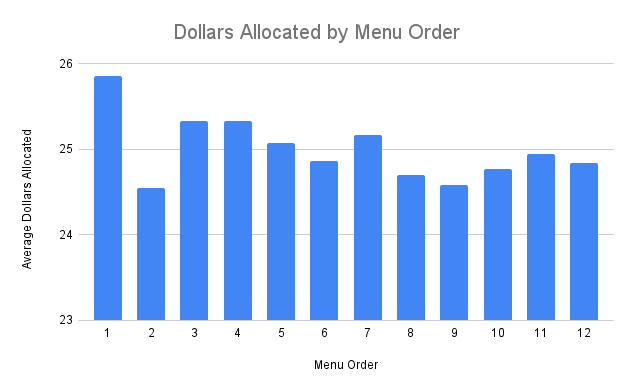
Note that this is on a very different scale than the chart above, done to draw attention to the fact that teams listed first on the menu get about $0.50 more than teams in any other spot, while teams listed second get less than any other spot. What explains this?
Well, it turns out that the teams listed first have an average finish of 5.76 (that is, they have a just-ab0ve-average finish compared to the rest of the league); the teams listed second have an average finish of 6.66. That less-than-one-place difference may not seem like much, but 5.76 is actually the best average finish by any spot in the menu order and 6.66 is the worst.
There is likely an explanation for teams that join first faring best. Those are league founders, often commissioners. Especially in younger leagues, they are likely to be more engaged and more familiar with the format than other teams.
So while it looks like teams listed first are getting hit particularly hard in arb and teams listed second aren’t, this is just a result of where those teams are finishing. The menu order has no meaningful impact on arbitration results.
What else explains what team gets the most or least arbitration? Not surprisingly having certain players has a big impact. The ten players who received the most arbitration this year were Julio Rodriguez, Shohei Ohtani, Yordan Alvarez, Aaron Judge, Sandy Alcantara, Spencer Strider, Austin Riley, Dylan Cease, Shane McClanahan, and Carlos Rodon. We’ll call these players “The Stars” for now. Teams that had at least one of those players received, on average, $5 more in arbitration than teams that had none of them.
But this effect was exaggerated on lower-ranked teams.
| 1st-3rd Place | 4th-6th Place | 7th-9th Place | 10th-12th Place | |
|---|---|---|---|---|
| Had One of the Stars | $30.34 | $27.65 | $25.47 | $23.31 |
| Did Not Have One of the Stars | $27.45 | $24.19 | $21.72 | $19.11 |
| Difference | $2.89 | $3.46 | $3.75 | $4.20 |
This chart shows that having these Stars, who were ideal targets for arbitration, pulled more dollars towards lower-ranked teams. Having a Star arbitration target was the equivalent of moving up 3-4 spots in the standings in terms of how much arbitration you attracted.
This isn’t a huge surprise, but I would argue it is inefficient. Is Spencer Strider worth handing arbitration to? Yes, for sure. But does it really make sense to give his team $3 more than their overall performance dictates just because they have him? Not really.
There is a piece missing here that I can’t measure – how much arbitration is drawn by projected future team performance that isn’t explained by 2022 results? Presumably, this is a lot and this would overlap with having these Stars. A team that finished 10th in 2022 but has Strider and Rodriguez to anchor their future might be projected to finish top-three in 2023, which would justify the increased allocations relative to 2022 finish.
My big takeaway here is just a word of warning – don’t allocate $3 to a player just because the player deserves it. Determine how much of a threat you think each team is and determine how much you want to allocate to that team. If you think a team is no threat to win in 2023 and they have Strider, your first step should be deciding to only give that team $1 and your second step should be giving that dollar to Strider.
We’ll look in more detail at player-level data in another article.
A long-time fantasy baseball veteran and one of the creators of ottoneu, Chad Young's writes for RotoGraphs, and can be heard on the Keep or Kut Podcast. You can follow him on Bluesky @chadyoung.bsky.social.
Very interesting. Thanks Chad.