
2015 Visualized: First Base
* * *
For the next few weeks, the RotoGraphs staff will devote an entire week to each defensive position, including spotlights on particular players as well as trends throughout the 2015 season. This week, we’re highlighting first basemen.
I don’t claim to be a Tableau (or data visualization) whiz by any means, but I thought it would be cool to visually represent the first base landscape in 2015 — with some analysis sprinkled in.
Steamer and ZiPS represent premier player projection systems; FanGraphs’ Depth Charts combines the two, and the writing staff allocate playing time accordingly. The playing time part is less important relative to the combined projections, as aggregated projections tend to perform better than standalones.
Previously, I compared actual WAR (wins above replacement) to projected WAR. This is not entirely helpful in a fantasy context, however, given WAR is a catch-all component metric for offense and defense. Defense doesn’t do us a whole lot of good for fantasy purposes.
Thus, I figured out a way to compare projected wOBA (weighted on-base average) from the preseason to actual wOBA (1) by team and (2) by player within team. Unlike WAR, wOBA is a rate metric, so it does not need to be scaled according to playing time.
First: the difference between a team’s wOBA generated by first basemen and their projected wOBA. Blue represents the highest expected wOBA; yellow represents lowest expected wOBA. The size of the bar above (below) the line represents actual wOBA above (below) expectations.
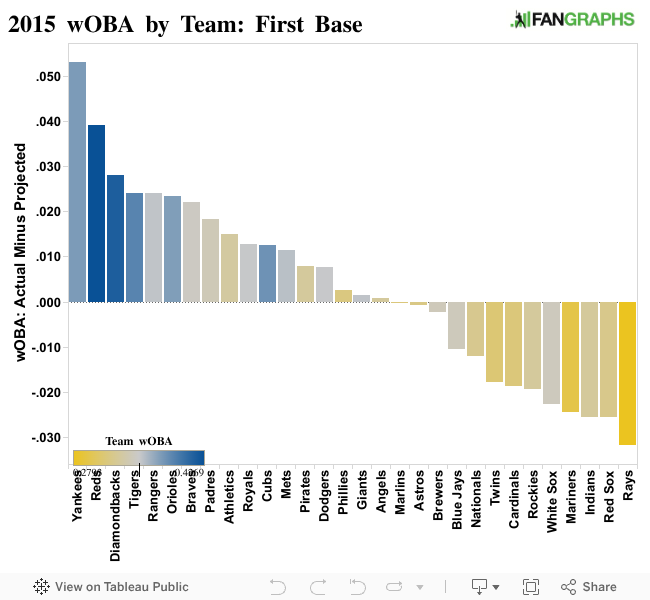
The measurements aren’t perfect — in an attempt to simplify matters, I included only players who recorded 50 plate appearances officially designated as a first baseman, so there are some omitted at-bats. Moreover, many American League first basemen spend a good deal of time as designated hitters. It’s worth noting, therefore, that their wOBAs displayed here may differ from their 2015 overall wOBA.
As a group, first basemen outperformed their projected wOBA by five point (.346 actual to .341 expected). A couple of teams who performed better than projected were carried mostly, if not entirely, by one player (Paul Goldschmidt for the Diamondbacks and Joey Votto for the Reds, to name the most prominent two). The Yankees saw unexpected, if not somewhat modest, production from their first basemen. The Blue Jays and White Sox managed to still generate above-average production despite falling short of projections.
Second: the difference between each player’s actual wOBA and his projected wOBA, categorized by team, represented by the distance of each dot from zero. Colors are scaled by actual wOBA, and dot magnitude represents sample size.

Steamer and ZiPS did not generate projections for a handful of first basemen, all of whom I will discuss briefly here:
- Max Muncy, OAK — .320 wOBA. Hit seven extra-base hits, including three home runs, in 53 ABs at first base.
- Chris Colabello, TOR — .378 wOBA. Made up for a lackluster Justin Smoak, hitting seven home runs in 133 ABs at first base. The .411 batting average on balls in play (BABIP) is peculiar, to say the least.
- Clint Robinson, WAS — .336 wOBA. Hit eight home runs in 153 ABs at first base — and only two home runs dring his remaining 199 ABs. Regardless, the lifelong Minor League journeyman displayed decent power and a solid eye at the plate in his first real taste of big-league action.
- Chris Parmelee — .295 wOBA. The 25-homer power looks less appetizing in consideration of a potentially, and perpetually, abysmal batting average.
- Brett Wallace — .383 wOBA. As my boy Billy Shakespeare once said, “All things regress.”
- Jake Elmore — .207 wOBA. One part forgivably woeful BABIP, two parts unforgivably woeful lack of batted ball authority.
- Travis Shaw — .352 wOBA. The largest sample size for an unprojected 2015 first baseman, Shaw demonstrated decent power (31 HR per 600 PA) and lukewarm plate discipline. A ninth-rounder in 2011, he’s Boston’s underwhelming first baseman of the future.
- Jefry Marte — .344 wOBA. Not particularly impressive nor unimpressive in any given tool, Marte premiered earlier than expected and held his own, albeit in a very small first-base sample (47 ABs).
- Gregory Bird — .372 wOBA. Arguably the biggest first-base call-up of 2015, the 22-year-old prospect notched a .268 isolated power (ISO) and 44.8-percent hard-hit rate (Hard%), the latter of which ranks second behind only Giancarlo Stanton for hitters with at least 170 PAs in 2015.
As aforementioned, Teixeira, Goldy and Votto all outperformed expectations. Chris Davis bounced back from an atrocious BABIP in 2014, and even the ailing Miguel Cabrera managed to beat out his projection during his time on the field. Some underrated 2015 (over-)performances include Mitch Moreland, Lucas Duda, Eric Hosmer, Anthony Rizzo and Justin Bour.
In fact, Bour is probably the most intriguing name on the list. Posting the 10th-largest margin between his actual and projected wOBAs, Bour hit 23 home runs in under 450 PAs, pacing out to more than 30 in a full season. The plate discipline leaves something to be desired, but it could be worse. More fly balls would be nice, as I don’t think he can sustain a ratio of home runs to fly balls (HR/FB) of 20-plus percent. Still, he’s a decent, cheap, sort of young bat for the perpetually rebuilding Marlins. If only they could use him as a designated hitter instead.
Joe Mauer, Carlos Santana and Jose Abreu could be considered busts. Mauer recorded the lowest BABIP of his career — deservedly so, perhaps, in light of his career-high ground ball rate (GB%) and equally alarming pull and hard-hit rates. Santana’s batted ball profile also dipped in 2015, helping explain performance decline. Abreu, however, may be the product of a lack of information — he was very likely to regress after his exceptional 2014 debut, so I don’t know if he deserves to shoulder too much blame here. He still hit 30 home runs with a .290 batting average.
” … Jose Abreu could be considered busts.”
Could he though? According to the fantasy value above replacement, he was ranked #7 among 1B.
http://www.fangraphs.com/fantasy/2015-end-of-season-rankings-first-basemen/
It’s relative, and even calling him a bust is a stretch. But he went 7th overall, and the 7th “true” first baseman off the board (aka not Buster Posey) went 35th overall. There’s a lot of value lost there. But it certainly could’ve been worse.
Also, I defer to this line: “he was very likely to regress after his exceptional 2014 debut, so I don’t know if he deserves to shoulder too much blame here”