You’ve Been Ambushed…Now What?
The word “Issue” and the name “Tarik Skubal” haven’t been used in the same sentence very often in 2025. The Detroit Tigers’ lefty is the clear frontrunner for winning the Cy Young award at the end of the season. However, back in May, hitters began ambushing Skubal, knowing their best chance of even being graced with a ball in play was on the first pitch.
| Month | Total First Pitches | Total First Pitch Swings | First Pitch Swing% | AVG | BABIP | SLG |
|---|---|---|---|---|---|---|
| March | 22 | 6 | 27.3% | 0.250 | 0.000 | 1.000 |
| April | 118 | 44 | 37.3% | 0.125 | 0.125 | 0.250 |
| May | 146 | 62 | 42.5% | 0.278 | 0.133 | 0.778 |
| June | 128 | 48 | 37.5% | 0.412 | 0.333 | 0.824 |
| July | 93 | 30 | 32.3% | 0.000 | 0.000 | 0.000 |
Hitters began swinging on the first pitch more often in May and saw some benefit, namely a better chance of getting a hit (AVG) and a much better chance of doing damage (SLG). And, even though they backed off slightly in June, hitters had their best month on the first pitch against the ace lefty, showcasing their most productive month on first pitches in all three metrics listed above. Once July came around, Skubal was on to their tricks, and the game of adjustments was adjusted; hitters were back to no-to-low production.
For context, here is a list of pitchers who threw at least 1,000 pitches (through Sunday, August 3rd) and have seen the highest first pitch swing rate so far in the 2025 season:
| Player | Total First Pitches | Total First Pitch Swings | First Pitch Swing% | AVG | BABIP | SLG |
|---|---|---|---|---|---|---|
| Bryan Woo | 525 | 204 | 38.9% | 0.329 | 0.273 | 0.585 |
| Kevin Gausman | 521 | 202 | 38.8% | 0.288 | 0.236 | 0.542 |
| Jacob deGrom | 499 | 192 | 38.5% | 0.290 | 0.258 | 0.403 |
| Brandon Pfaadt | 505 | 194 | 38.4% | 0.397 | 0.350 | 0.698 |
| Chad Patrick | 401 | 153 | 38.2% | 0.264 | 0.226 | 0.415 |
| Tarik Skubal | 533 | 203 | 38.1% | 0.254 | 0.154 | 0.644 |
| Kyle Freeland | 460 | 173 | 37.6% | 0.435 | 0.420 | 0.551 |
| Ryan Pepiot | 533 | 199 | 37.3% | 0.290 | 0.258 | 0.565 |
| George Kirby | 296 | 110 | 37.2% | 0.367 | 0.300 | 0.700 |
| Logan Gilbert | 316 | 117 | 37.0% | 0.267 | 0.185 | 0.633 |
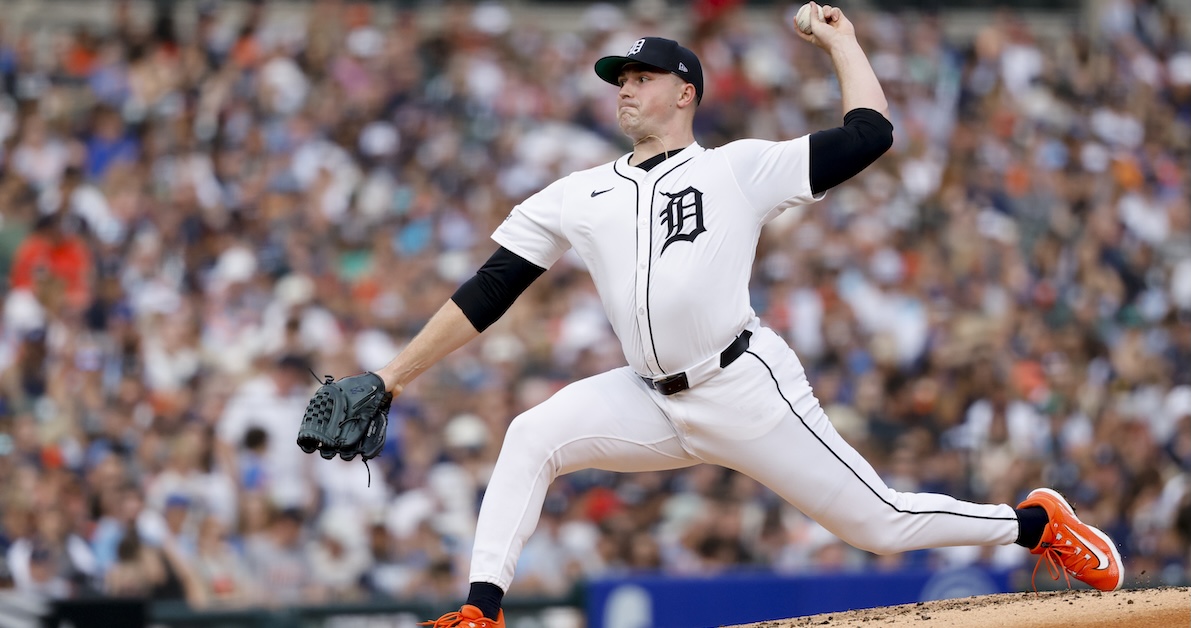
Hitters ambush pitchers for different reasons. Tarik Skubal had a first-half ERA of 2.23 and a batting average against of .193. Kyle Freeland’s first-half ERA was 5.44, and hitters got to him for a .314 batting average. I should note that without the context of how many balls in play occurred on these 0-0 counts, it’s hard to contextualize the batting average and slugging percentages above. We’ll fix that in a bit, but for now, try to think as a hitter would, looking for a pre-matchup edge. When hitters are prepping for Freeland, they see this…
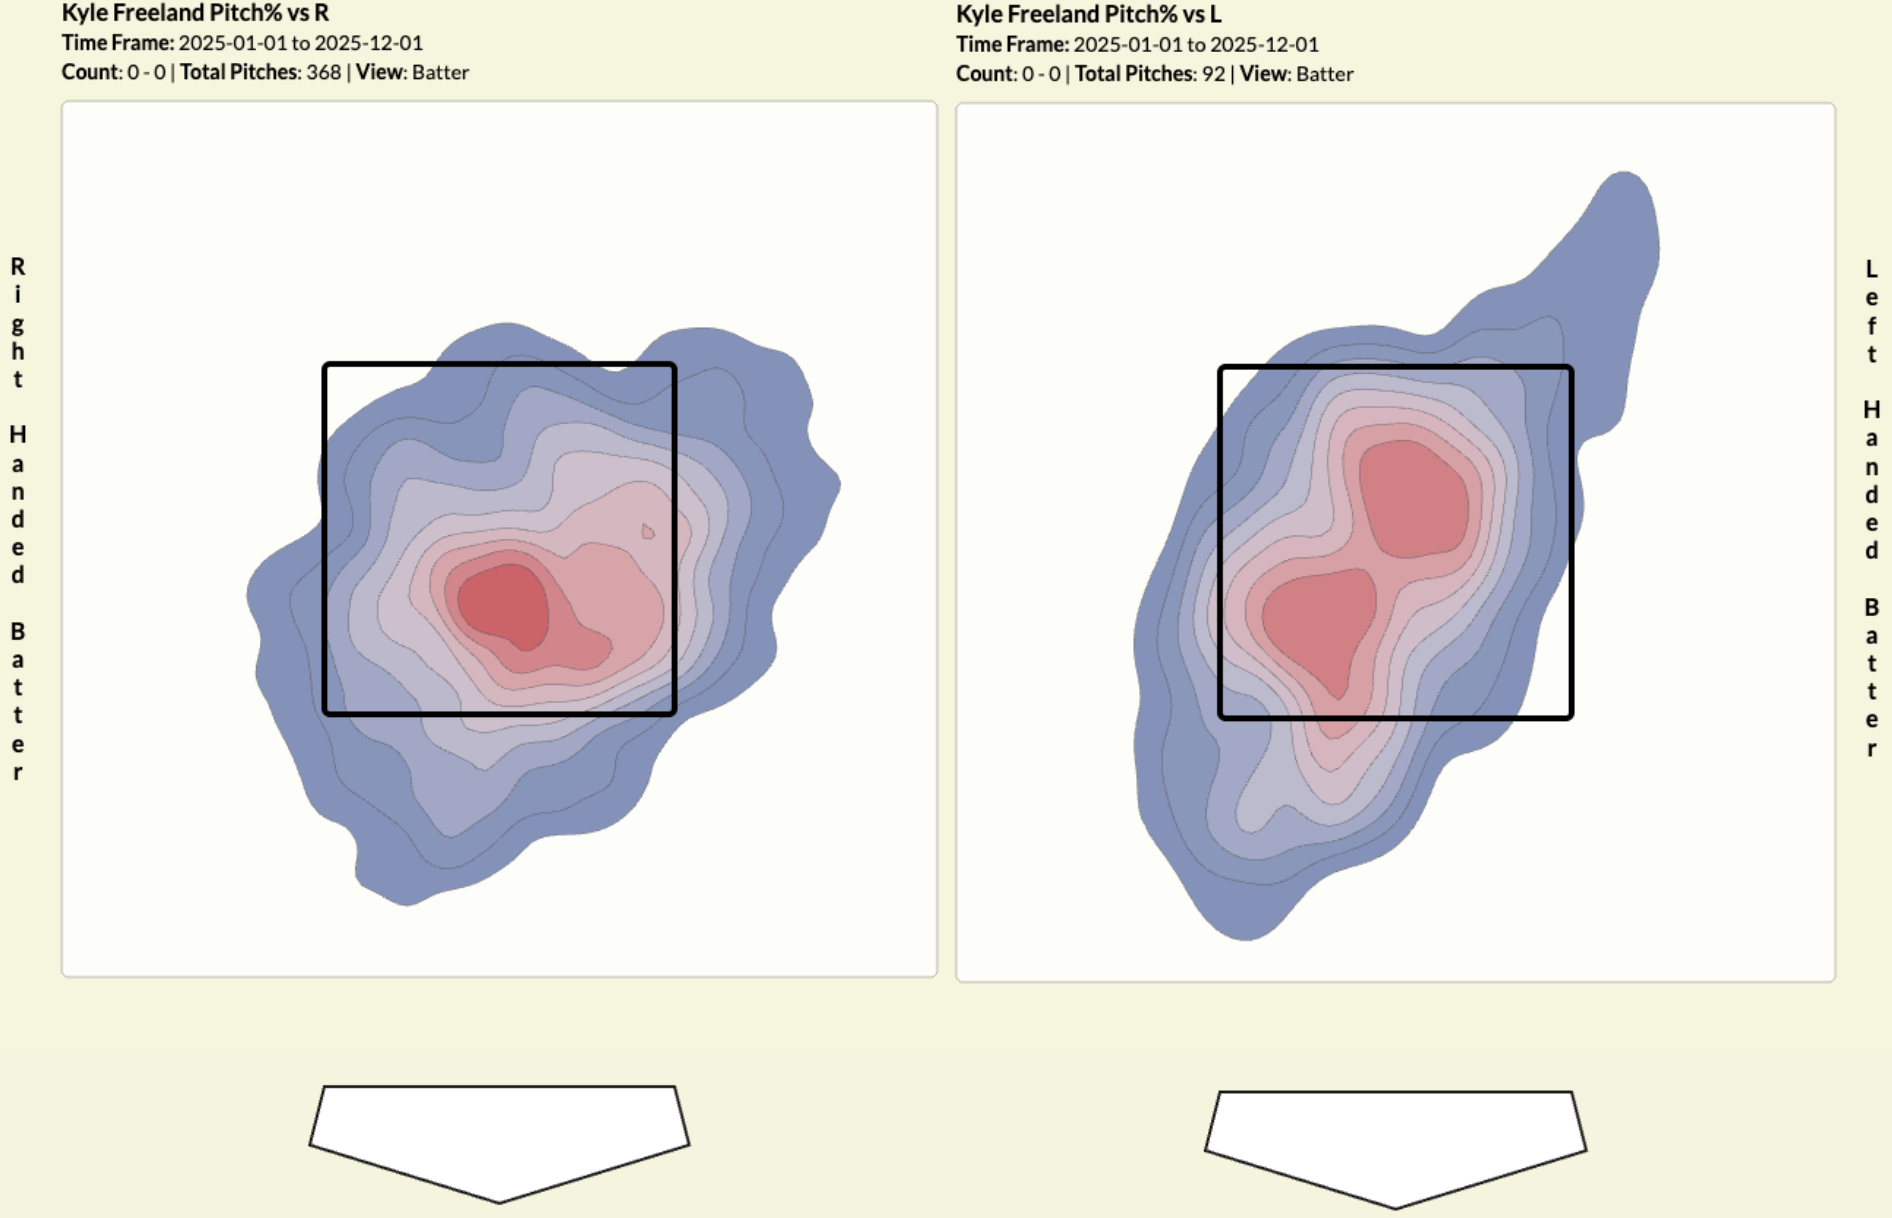
…and if the in-house team dashboard iPad app thingy is smart enough, it’s paired with the knowledge that Freeland throws a first pitch four-seamer 36.3% of the time, that it’s below average from a Stuff+ standpoint, and that it rises and tails less than the average left-handed pitcher. So, swing on the first pitch against Freeland because you’re likely to get a fastball in the zone and it’s easy to hit. A .435 batting average with only one swing isn’t hard to sell. On the flip side, hitters prepping for Skubal see this…
…and they likely pair it with the knowledge that Skubal’s fastball is elite, though they don’t need an iPad for that. Skubal doesn’t throw a four-seamer as a first pitch as often as Freeland, he only does that 20.3% of the time. Here’s how the season has gone for Freeland when it comes to “first pitch swingin'”:
| Month | Total First Pitches | Total First Pitch Swings | First Pitch Swing% | AVG | BABIP | SLG |
|---|---|---|---|---|---|---|
| March | 20 | 5 | 25.0% | 0.000 | 0.000 | 0.000 |
| April | 115 | 46 | 40.0% | 0.579 | 0.579 | 0.737 |
| May | 144 | 54 | 37.5% | 0.526 | 0.737 | 0.737 |
| June | 69 | 21 | 30.4% | 0.444 | 0.444 | 0.556 |
| July | 112 | 47 | 42.0% | 0.238 | 0.238 | 0.238 |
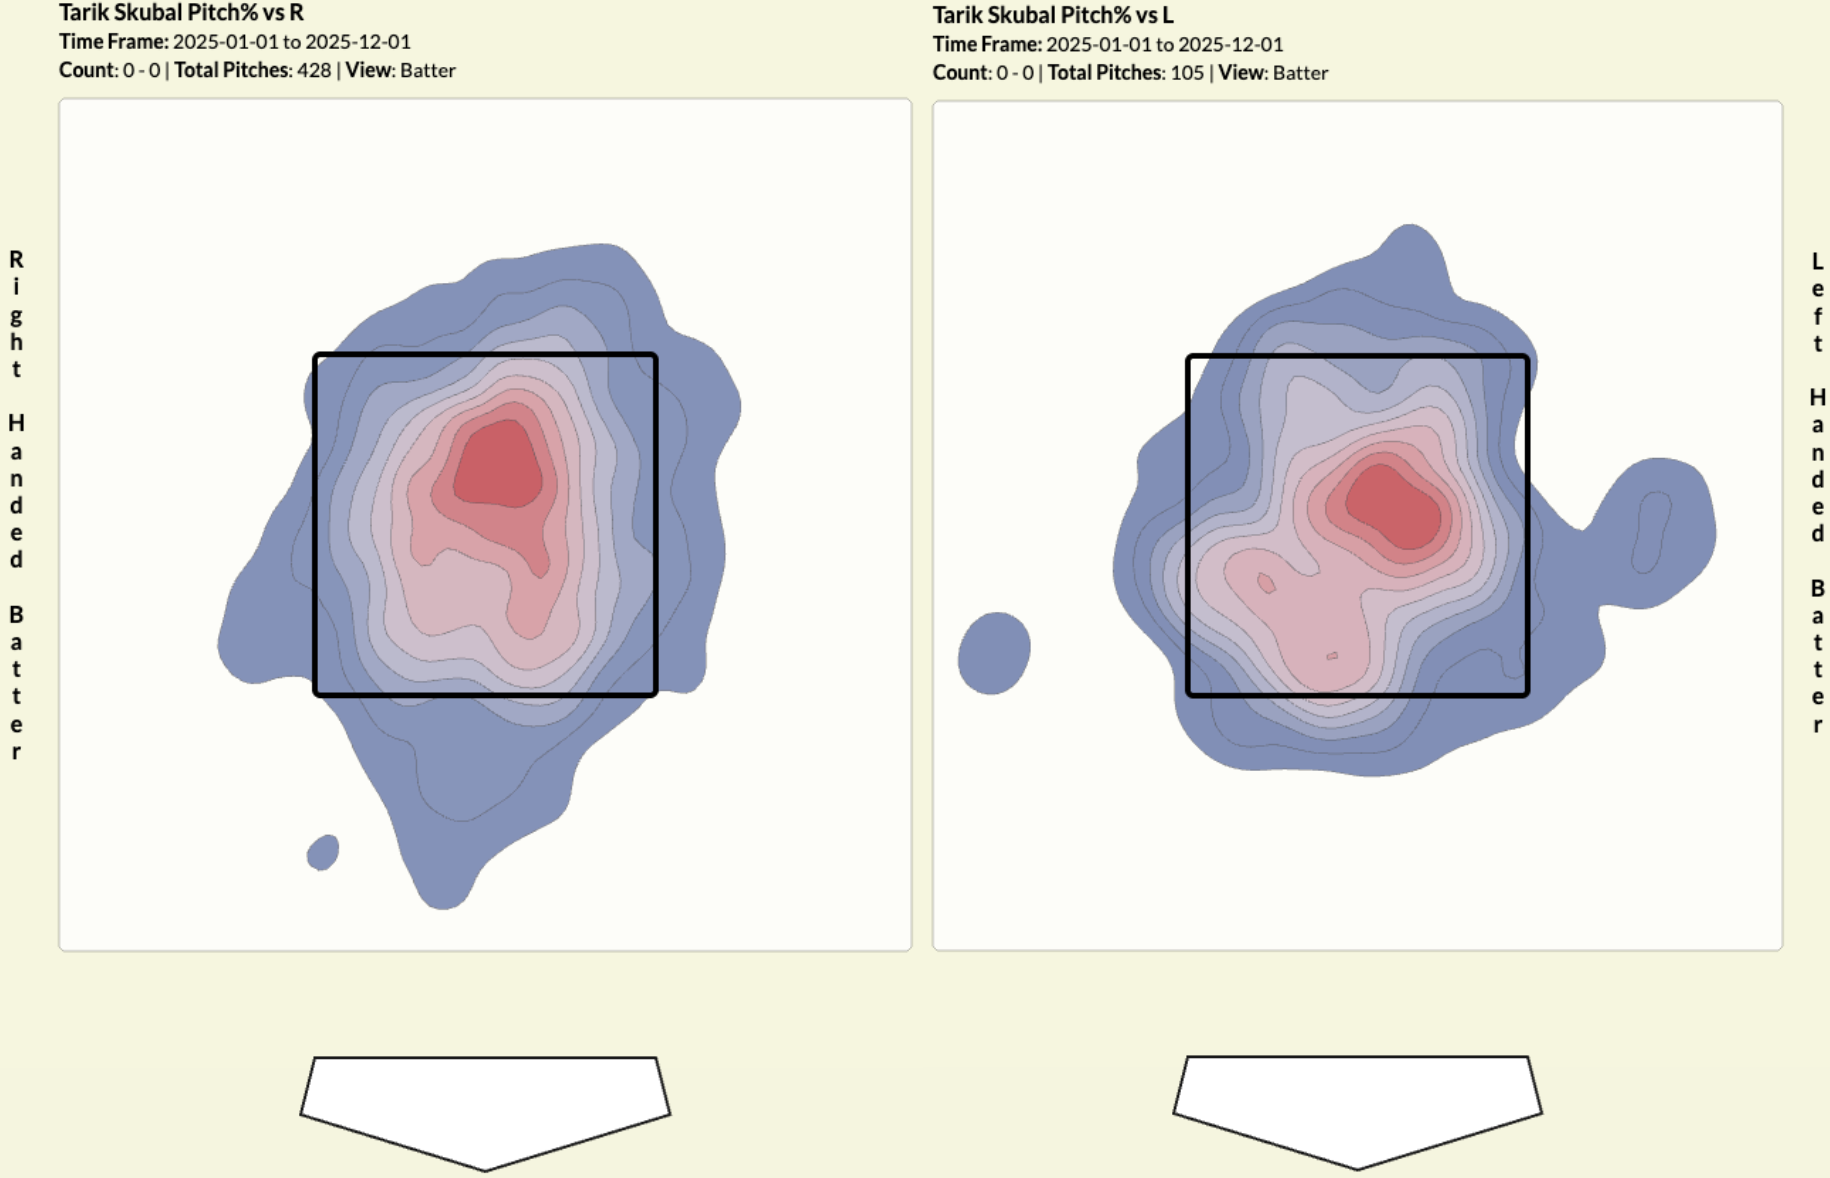
Through May, both Skubal and Freeland saw hitters swing the bat at their first pitch at high rates. Skubal continued to see this high rate through June, while Freeland’s opponents began backing off but remained productive when they did swing. For both pitchers, something needed to change. How did these pitchers adjust? Skubal started throwing fewer strikes in 0-0 counts, and Freeland leaned in and threw them more often:
Click to Enlarge
Pitchers adjust, hitters adjust, and the world keeps on spinnin’. These two pitchers adjusted differently. Skubal threw first pitches in the zone slightly more often in May, and hitters began swinging more often. The word was out. Get to Skubal early, and you may have a chance. Remember from the table above that hitters improved upon a .125 average against Skubal in April with a .278 average in May. Skubal stayed in the zone at the same rate, and hitters dropped off the aggressive swing approach somewhat, but kept their F-Swing% in the high 30s and were rewarded with a .412 batting average. That’s when Skubal and the Tigers took notice and avoided the zone less on the first pitch, resulting in fewer first pitch swings and fewer (or literally no) hits by the time July was on record. It wasn’t just “in-the-zone” or “out-of-zone” decision-making that helped Skubal curb hitters in 0-0. It was his pitch mix as well. Notice the change that took place between June and July when he stayed in the zone:
| Month | CH | FF | KC | SI | SL |
|---|---|---|---|---|---|
| March | 7.7 | 46.2 | 15.4 | 7.7 | 23.1 |
| April | 18.7 | 22.7 | 1.3 | 33.3 | 24.0 |
| May | 18.2 | 16.2 | 1.0 | 45.5 | 19.2 |
| June | 10.2 | 20.5 | 3.4 | 46.6 | 19.3 |
| July | 25.0 | 17.9 | 3.6 | 37.5 | 16.1 |
Hitters were a little too confident gearing up and swinging out of their shoes on fastballs and sinkers that both average 97 MPH, so Skubal decided to double his changeup usage on the first pitch. That’ll teach em’. You have to see it for yourself:
Link to video of a first pitch swinging strike on a changeup
It didn’t just fool hitters who were pumped up, ready to hit a fastball, and fully committed to the swing. It also stole called strikes at elevated rates.
Tarik Skubal’s Called Strike Rate on 0-0 Changeups Thrown in the Zone by Month
Mar/Apr: 60.0% -> May: 38.9% -> June: 33.3% -> July: 64.3%
This pattern exists for nearly every pitcher, but take a look at the difference between 0-1 and 1-0 for Skubal:
| Through Count | K% | AVG | BB% |
|---|---|---|---|
| Through 1 – 0 | 25.5% | 0.203 | 7.0% |
| Through 0 – 1 | 44.5% | 0.182 | 2.5% |
It’s better for Skubal to get strike one than it is for him to avoid the zone completely, though he’s fine either way. But you can see how Skubal’s adjustment was strategic. He threw a little less in the zone, and when he stayed in the zone, he altered his pitches. What about Freeland?
| Month | CH | FC | FF | KC | SI | ST |
|---|---|---|---|---|---|---|
| March | 0.0 | 9.1 | 27.3 | 0.0 | 54.5 | 9.1 |
| April | 2.9 | 13.0 | 36.2 | 10.1 | 30.4 | 7.2 |
| May | 7.4 | 25.9 | 39.5 | 11.1 | 8.6 | 7.4 |
| June | 0.0 | 28.2 | 64.1 | 7.7 | 0.0 | 0.0 |
| July | 0.0 | 24.3 | 58.6 | 15.7 | 0.0 | 1.4 |
Between May and June, his first pitch zone rate went relatively unchanged, but hitters stopped swinging as aggressively. It’s a mystery to me why that would have been. In doing so, they lost production, dropping in AVG, BABIP, and SLG, though they remained productive. Hitters were taking a lot of fastballs in the zone on the first pitch:
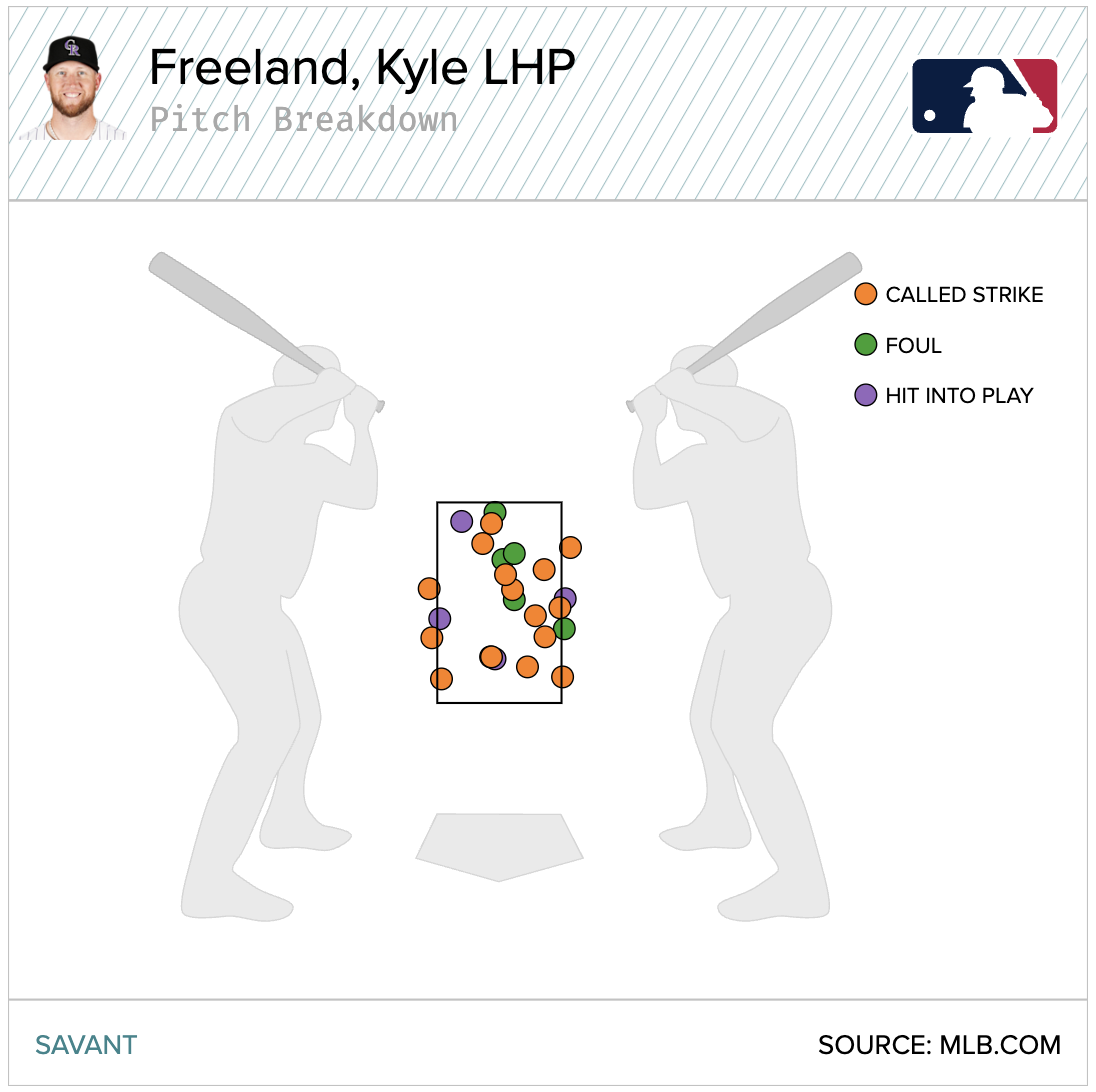
Kyle Freeland’s first-pitch (0-0) in-zone four-seamers in June.
The answer to why hitters were willing to watch a fastball go by on pitch one is likely two-fold. First, a lot of those four-seamers were questionably “in-zone”, and second, it doesn’t really matter if you give Freeland a strike:
| Through Count | K% | AVG | BB% |
|---|---|---|---|
| Through 1 – 0 | 11.2% | 0.242 | 11.8% |
| Through 0 – 1 | 23.1% | 0.302 | 3.8% |
With a strike on their hands, hitters still have a better-than-average chance of getting a hit. With a ball? Still a better-than-average chance of earning a walk. There’s less of a pattern here because swinging or not swinging on Kyle Freeland’s first pitch is way less consequential than swinging or not swinging on Tarik Skubal’s first pitch. Freeland can steal strikes and keep hitters on their toes, but ultimately, he doesn’t have the privilege of being able to see better results by just throwing more 0-0 changeups.
It turns out that even with all those first pitch swings, Freeland’s July was his best month by ERA (4.39) and opponents’ slash lines (.240/.295/.462), though the damage can still be viewed in that above-average slugging percentage. Freeland may need to be less in the zone on first pitch. He doesn’t have an issue with walking batters in aggregate. His BB% on the season is 5.8% and it has been around that mark in the last two seasons. But, he’s only striking batters out 16.0% of the time, and that’s the big issue. If it’s an easy pitch to hit in 0-0, it will be an easy pitch to hit in any count.
We can isolate pitchers who were ambushed in July by searching for those who were swung on often at the first pitch. We’ll call that greater than or equal to 35%. To keep the sample relevant, let’s say the pitcher had to throw 0-0 pitches at least 60 times, the same as total batters faced. Next, we need a metric to identify who has been getting hit. Looking at batting average doesn’t help much. For example, Tyler Glasnow’s 0-0 count batting average against is .500, but only five of his ten balls in play (plus one homerun) fell for hits in July. Let’s use balls in play, plus home runs, divided by total 0-0 pitches; (BIP+HR)/Pitch, and we’ll sort by that mark. This shows us a list of pitchers who are getting their defense moving quickly on first pitch:
| Name | Pitches | F-Swing% | (BIP+HR)/Pitch | AVG | BABIP | SLG |
|---|---|---|---|---|---|---|
| Miles Mikolas | 111 | 41.4% | 0.216 | 0.273 | 0.200 | 0.682 |
| Colton Gordon | 102 | 44.1% | 0.216 | 0.389 | 0.333 | 0.556 |
| Shane Baz | 124 | 38.7% | 0.210 | 0.435 | 0.350 | 1.000 |
| Jason Alexander | 64 | 50.0% | 0.203 | 0.231 | 0.231 | 0.462 |
| Jonathan Cannon | 120 | 40.0% | 0.200 | 0.478 | 0.455 | 0.783 |
| Chris Paddack | 112 | 40.2% | 0.196 | 0.450 | 0.389 | 0.800 |
| Stephen Kolek | 74 | 45.9% | 0.189 | 0.417 | 0.300 | 0.917 |
| Kyle Freeland | 112 | 42.0% | 0.188 | 0.238 | 0.238 | 0.238 |
| Erick Fedde | 66 | 36.4% | 0.182 | 0.417 | 0.417 | 0.417 |
| Bryce Elder | 100 | 35.0% | 0.180 | 0.588 | 0.563 | 1.000 |
| Brandon Woodruff | 84 | 39.3% | 0.179 | 0.357 | 0.308 | 0.714 |
| Richard Fitts | 68 | 41.2% | 0.176 | 0.364 | 0.300 | 0.636 |
| Ranger Suárez | 102 | 38.2% | 0.176 | 0.412 | 0.375 | 0.588 |
| Nick Martinez | 142 | 35.2% | 0.176 | 0.429 | 0.364 | 0.619 |
| Zack Littell | 122 | 44.3% | 0.172 | 0.350 | 0.316 | 0.650 |
| Bryan Woo | 125 | 48.8% | 0.168 | 0.444 | 0.375 | 0.833 |
| Ryne Nelson | 114 | 36.0% | 0.167 | 0.278 | 0.235 | 0.500 |
| Andrew Abbott | 122 | 35.2% | 0.164 | 0.471 | 0.444 | 0.471 |
| Lucas Giolito | 119 | 37.8% | 0.160 | 0.500 | 0.385 | 1.188 |
| Max Scherzer | 88 | 43.2% | 0.159 | 0.333 | 0.200 | 0.917 |
| Janson Junk | 114 | 36.8% | 0.158 | 0.250 | 0.222 | 0.375 |
| Charlie Morton | 134 | 35.1% | 0.157 | 0.350 | 0.316 | 0.500 |
| Anthony DeSclafani | 64 | 40.6% | 0.156 | 0.250 | 0.143 | 0.750 |
| Ryan Gusto | 90 | 35.6% | 0.156 | 0.308 | 0.250 | 0.692 |
| Mitchell Parker | 105 | 38.1% | 0.152 | 0.333 | 0.286 | 0.667 |
| Patrick Corbin | 112 | 37.5% | 0.152 | 0.313 | 0.267 | 0.625 |
| Chris Flexen | 74 | 37.8% | 0.149 | 0.300 | 0.222 | 0.600 |
| Grant Holmes | 116 | 40.5% | 0.147 | 0.250 | 0.250 | 0.250 |
| Trevor Rogers | 96 | 37.5% | 0.146 | 0.000 | 0.000 | 0.000 |
| Adrian Houser | 105 | 36.2% | 0.143 | 0.333 | 0.333 | 0.400 |
It’s a personalized approach when fixing these ailments. Some of these pitchers are really, really good. Maybe they could back off fist pitch fastballs. Some of these pitchers are not so good. Maybe they should focus on improving on what they can offer. Some of them may be too predictable and need to drop a changeup in there like Skubal. Whatever the strategy is, something needs to change to help them get to the next pitch more often.