You’re Going…A Third Time Through the Order?!
A starting pitcher going three times through the order has been one of those analytically driven game tactics that have had an effect on the game-by-game innings accumulation of starting pitchers. Fantasy managers playing in standard 5×5 roto-leagues know that the only way to decrease a ratio statistic like WHIP ((BB + H) / IP), is to add more numbers into the denominator (IP) while keeping the numerator (BB + H) the same. A pitcher who goes three times through the order is also likely to accumulate a lot of innings. The more quality innings accumulated, the better off your ratios will be. If a starting pitcher faces the lineup a third time and it’s only the fourth inning, chances are they are not going back out for the fifth. So, if we find pitchers who consistently face the order in its entirety a third time, we can generally assume it’s because they are pitching well.
First, let’s look at the qualified starters who have gone a full third time (TBF >= 27) through the order in at least 4 separate starts:
*Table has been updated to include stats and fixed to only include qualified starters.
| Name | Count | BB% | Soft% | WHIP | GB% | HR/9 | LOB% | |
|---|---|---|---|---|---|---|---|---|
| 1 | Zack Wheeler | 11 | 6.0% | 22.5% | 0.97 | 48.0% | 0.59 | 82.3% |
| 2 | Shane Bieber | 9 | 8.6% | 18.1% | 1.25 | 44.4% | 1.09 | 80.7% |
| 3 | Zack Greinke | 7 | 5.1% | 18.6% | 1.15 | 40.2% | 1.13 | 76.6% |
| 4 | Aaron Civale | 7 | 6.0% | 16.7% | 1.06 | 45.3% | 1.29 | 80.1% |
| 5 | Wade Miley | 6 | 6.5% | 16.3% | 1.11 | 53.3% | 0.66 | 75.4% |
| 6 | José Berríos | 6 | 6.2% | 15.6% | 1.14 | 42.9% | 1.05 | 75.1% |
| 7 | Trevor Bauer | 6 | 8.6% | 16.9% | 1.0 | 33.5% | 1.59 | 88.9% |
| 8 | Clayton Kershaw | 6 | 4.4% | 17.2% | 0.98 | 48.2% | 1.06 | 74.2% |
| 9 | Kyle Hendricks | 6 | 4.8% | 19.5% | 1.27 | 40.9% | 1.94 | 81.7% |
| 10 | Sandy Alcantara | 6 | 6.8% | 18.2% | 1.07 | 53.3% | 0.84 | 74.3% |
| 11 | Ryan Yarbrough | 5 | 4.1% | 22.5% | 1.19 | 37.4% | 1.36 | 64.3% |
| 12 | Adam Wainwright | 5 | 6.6% | 14.5% | 1.1 | 47.3% | 1.16 | 78.2% |
| 13 | Germán Márquez | 5 | 9.8% | 18.5% | 1.19 | 54.3% | 0.63 | 70.8% |
| 14 | Chris Bassitt | 5 | 6.2% | 18.8% | 1.03 | 43.6% | 0.76 | 78.2% |
| 15 | Sean Manaea | 5 | 6.1% | 16.8% | 1.24 | 40.0% | 0.92 | 81.5% |
| 16 | Merrill Kelly 켈리 | 5 | 6.0% | 15.1% | 1.27 | 45.2% | 1.28 | 68.0% |
| 17 | Kevin Gausman | 4 | 6.4% | 18.3% | 0.81 | 44.2% | 0.71 | 86.4% |
| 18 | Lucas Giolito | 4 | 8.0% | 18.3% | 1.1 | 33.5% | 1.73 | 77.4% |
| 19 | Brad Keller | 4 | 10.8% | 14.5% | 1.88 | 48.5% | 1.33 | 64.9% |
| 20 | Tyler Glasnow | 4 | 7.9% | 12.6% | 0.93 | 45.3% | 1.02 | 82.4% |
| 21 | Cole Irvin | 4 | 4.3% | 12.2% | 1.22 | 36.1% | 0.86 | 73.6% |
| 22 | Kyle Gibson | 4 | 7.3% | 12.7% | 1.01 | 51.8% | 0.6 | 85.1% |
| 23 | Aaron Nola | 4 | 5.5% | 19.5% | 1.22 | 40.6% | 1.32 | 72.3% |
| 24 | Mike Minor | 4 | 7.1% | 15.6% | 1.29 | 37.9% | 1.4 | 65.1% |
| 25 | Antonio Senzatela | 4 | 5.2% | 11.3% | 1.4 | 52.9% | 0.92 | 67.0% |
Next, as going through the order three times is likely a product of coaching and organizational philosophy, let’s also look at the teams that have allowed their starter (now including non-qualified starters) to go a full third time through the order or more this season:
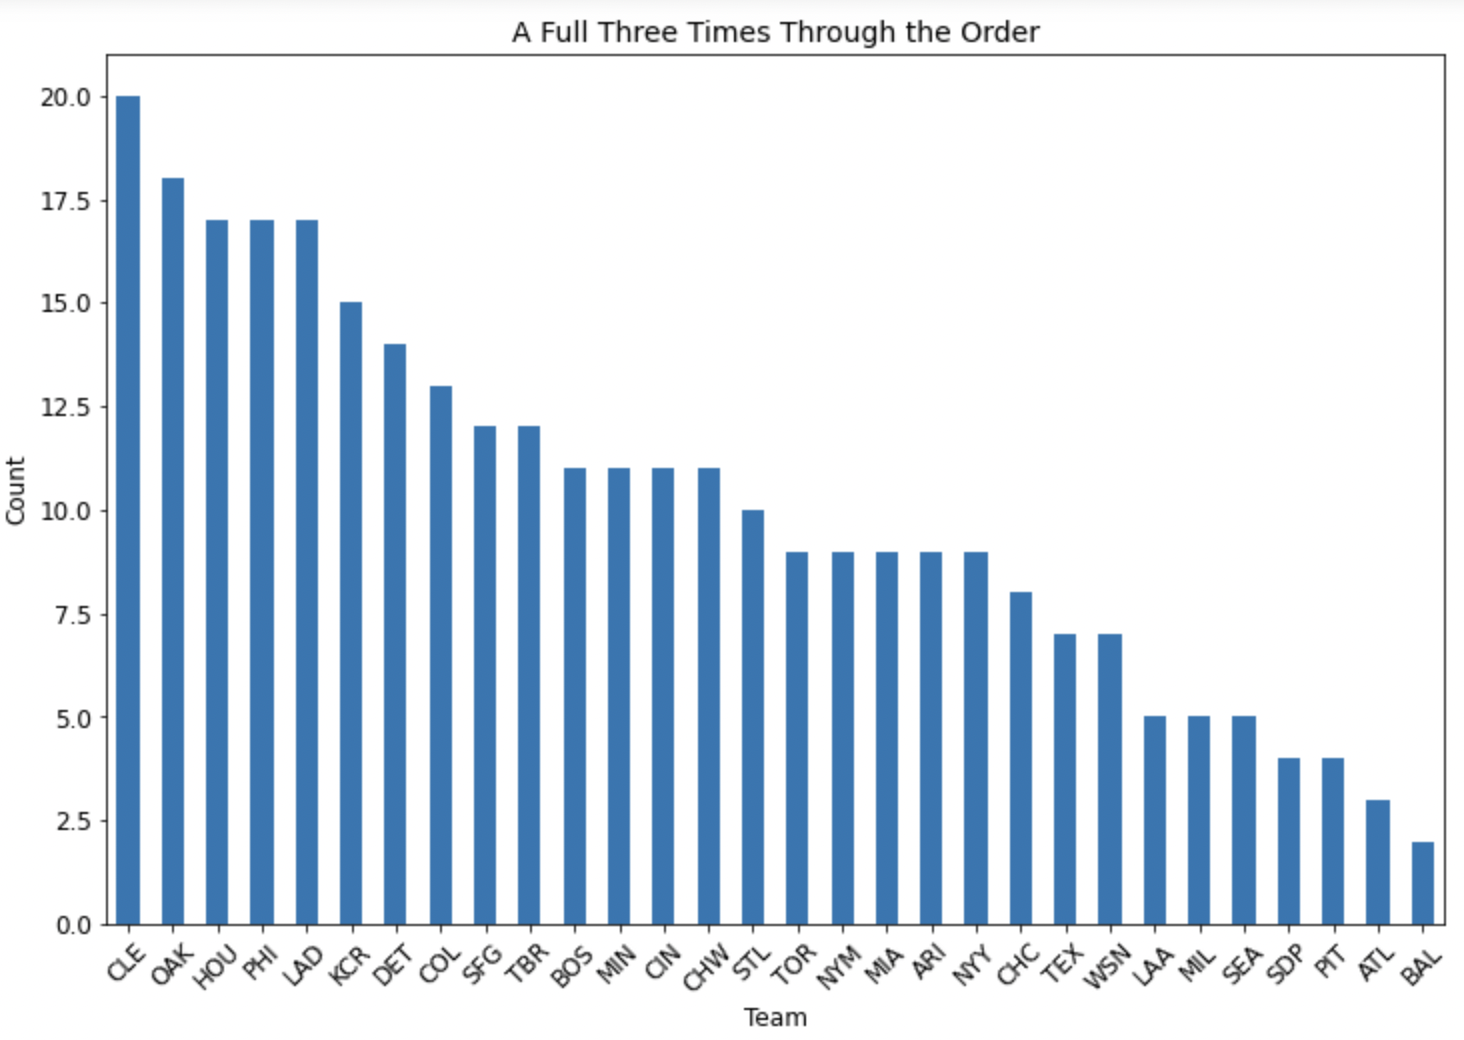
Cleveland has been known to let pitchers go and the data backs that up. With Aaron Civale, Shane Bieber, and Zack Plesac on the IL, there could be an opportunity here for a younger pitcher to start adding more innings. However, looking at Cleveland’s current starting rotation on their roster resource page doesn’t have me frantically clicking towards a waiver claim just yet.
Oakland comes in at second place with Sean Manaea, Chris Bassitt, and Cole Irvin all being pitchers who could be low-key trade targets or possibly on the wire. The Astros, Phillies, and Dodgers are all tied, allowing starters to go a full three times through 17 separate times. Using this combination of team philosophy and starter longevity leads me to believe that pitchers on the IL that may have been dropped such as Aaron Civale and Zack Plesac are worth picking up and adding to your IL if you have the room. You may need to wait for them to build back up again, but Cleveland has proven to let them go when they’re on. Otherwise, focusing on streamer options on these teams could give owners a few more IPs to help balance out those ratios, as long as you pick the right streams.
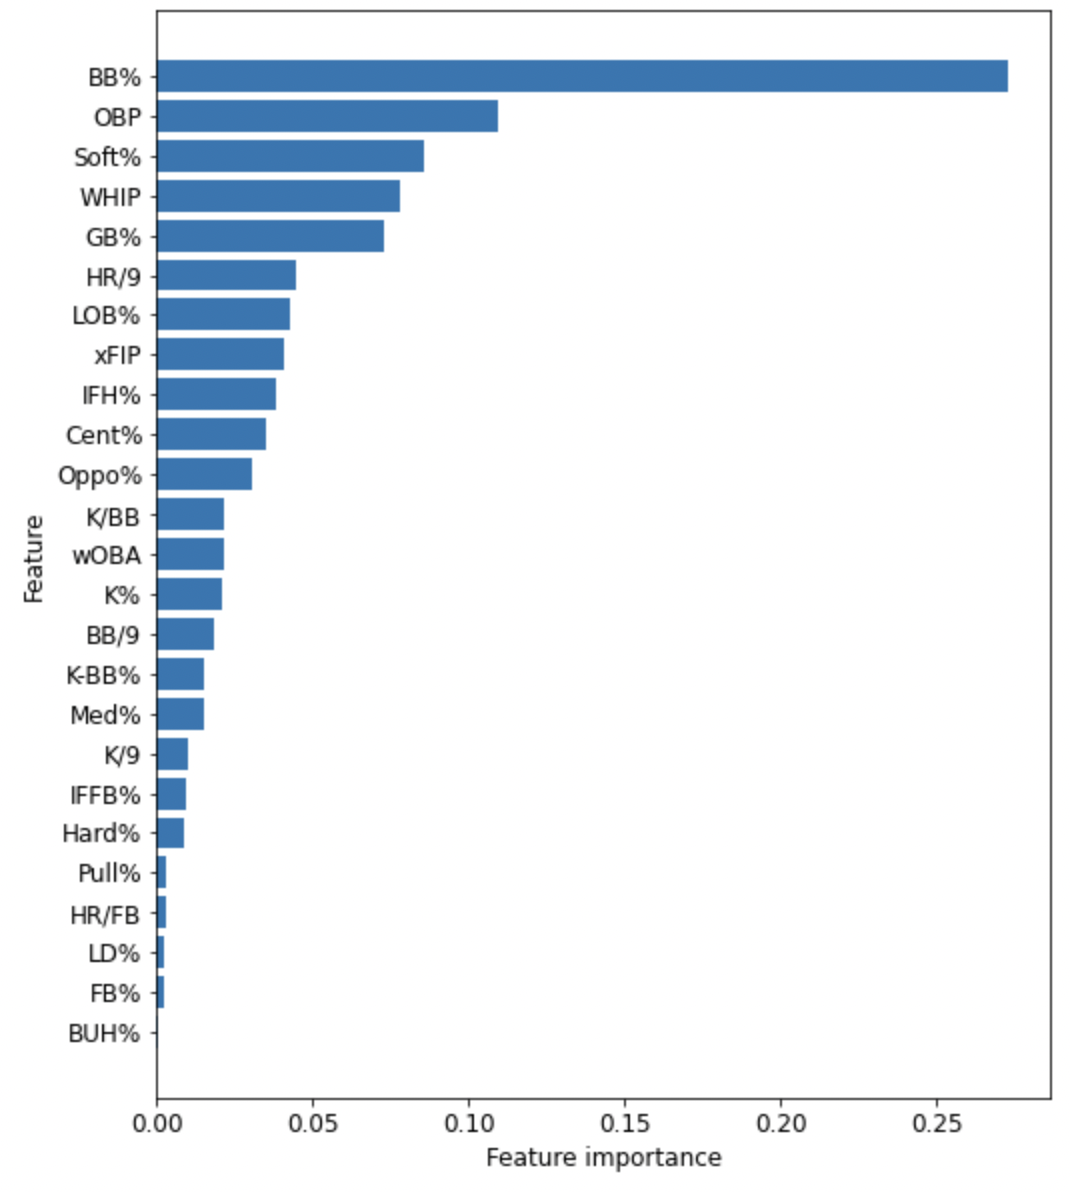
Finally, I was curious about what a pitcher going through the order a third time might do, that’s different from a starter who doesn’t. The obvious answer would be that starters giving up hits and walks and runs probably aren’t going to see the lineup a third time. But what statistics are predictive of a third time through the order performance? In other words, what did pitchers who went a third time through have in common during their starts? In order to answer this, I split all 2021 starts into two groups and created a decision tree model to classify a binary target (1: starter TBF >=27 and 0: starter TBF <= 18). Here’s what the decision tree finds to be most predictive of that binary target:
To analyze this on an aggregated level here’s how these two groups performed:
| Target | BB% | OBP | Soft% | WHIP | GB% | HR/9 | LOB% |
|---|---|---|---|---|---|---|---|
| 0 | 12% | 0.372 | 15% | 2.15 | 41% | 2.1 | 67% |
| 1 | 6% | 0.281 | 19% | 1.16 | 47% | 0.9 | 81% |
1: TBF >= 27
Among qualified pitchers in 2021
What’s the takeaway here? If you’re looking for a streamer, a waiver claim, or a trade target, and you are in need of more innings to bring down your ratios, pay attention to team tendency and stats like BB%, LOB%, and soft contact/ground ball percentages. The best thing to do to gain the confidence of a manager seems to be not letting anyone get on base in the first place. But, if runners are allowed to get on base, they need to stay on base. While this may feel a bit like an off-season, draft-prep-styled article, I’m certain a lot of those pitchers listed in the first table are available in your league, ready to go a third time through the order.
For the 1st chart, might be useful to put their year long numbers for the relevant stats, especially BB% since that seems so much more predictive than the other ones.
Good call…updated.