
The Top 30 Projected Hitting Prospects Entering 2024

This article ranks the game’s top projected hitting prospects by peak wRC+ heading into 2024 (it does not incorporate any 2024 data). It is a counterpart to this February piece on baseball’s top projected pitching prospects. I only just got done with my offseason methodological updates for hitters–please forgive me for publishing this one week into the season!
Overview
Like for pitchers, I take every professional hitter’s recent historical performance across the minors and majors and adjust it for the player’s age, league difficulty, league scoring environment, and park. I also apply regression to the mean to a player’s performance, using regression amounts that minimize prediction error when testing them on historical data. Instead of regressing every player toward the same mean, I regress each player toward a mean weighted by their probability of making the major leagues—with their likelihood of making the major leagues a function of a player’s age relative to level. Taken together, these adjustments convert every performance to the same peak major league baseline—creating a “peak major league equivalency”—making it easier to compare players across leagues and at different ages. Most projection systems make use of a similar methodology to project minor leaguers for the current year.
Unsolicited methodological detail
When devising a projection system, there are hundreds of methodological decisions to be made. All models rely on simplifying assumptions, after all, blending art and science. I will go into some of the more essential ingredients here to give readers a peak behind the curtain. Throughout this section, you’ll see instances where I had to use judgment, informed by theory and previous research, to decide on an approach.
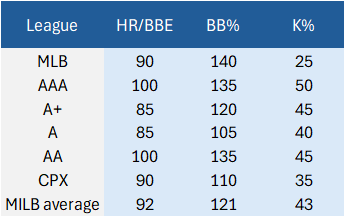
Figure 1 shows the translations used to adjust for league difficulty. For instance, a 170 wRC+ at Class A is equivalent to a 100 wRC+ at the major league level according to these translations. The translations are based on 2021 to 2023 transitions across leagues—starting in 2021 to capture the new minor league landscape (I also have translations for the old minor league alignment–they are broadly similar). There are small translation differences across leagues within a given level, but they are small enough that I decided to group all leagues within a level together this time around. I also have translations for the various component statistics, K%, BB%, HR/BBE, etc.
Figure 1. Major league translations.

Figure 2 shows the aging curves I use to convert performances at different ages to peak performance, with peak defined at 28-ish here. Note that different studies find slightly different peak ages, but they all tend to find more or less a plateau between 25 and 31, with most growth occurring in the teenage years and early 20s. According to these aging curves, a 19-year-old with a 100 wRC+ will be a 135 wRC+ player at peak—i.e., a league average 19-year-old will typically grow to eventually become one of the best hitters in the game. The aging curves are based on historical data, but they happen to resemble the MARCEL aging curves very closely. I also constructed similar aging curves for the various component statistics.
Figure 2. Aging curves.
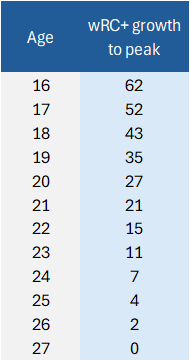
Figure 3 shows a player’s probability of making the majors by their age relative to the level they are playing in, with younger players at a given level having a better chance of making the majors, all else equal. For instance, according to these probabilities, a 22-year-old in High-A has a 40% chance of making the majors. Accordingly, when I regress this player’s statistics toward the mean, I regress them 40% toward the major league mean (e.g., 100 wRC+), and 60% toward a lower minor league mean (I chose close to a 70 wRC+, the Triple-A mean on an MLB scale), reflecting their probability of making the majors. These probabilities are based on historical data as well.
Figure 3. A player’s probability of making MLB by age relative to level.
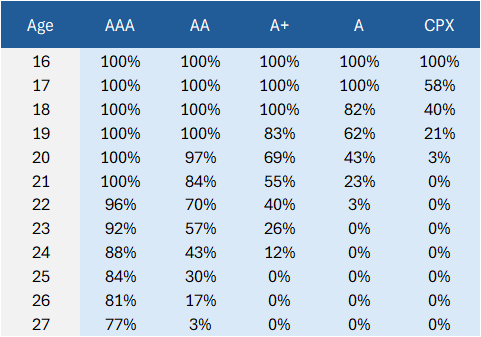
Figure 4 shows the regression amount that minimizes prediction error for a given statistic when predicting itself in the future. It is based on 2021 to 2023 data. I split the sample in half, then added in a regression amount to minimize prediction error when using the first half of a sample of a statistic to predict itself in the second half of the same sample. I split the sample in half in two ways: even and odd plate appearances, and first half and second half plate appearances. I then averaged the two regression amounts. I also split the sample randomly for robustness, but the results were similar, so I stuck with the simpler methods. For instance, when using the first half of 2022 Double-A HR/BBE to predict the second half of 2022 Double-A HR/BBE for players, adding in a regression amount of 100 league average batted ball events minimized the prediction error. Although there were small differences in regression amounts across levels, my takeaway from this exercise was that the regression amounts were “close enough” across the minors and majors, statistical noise notwithstanding, and I opted to use the same regression amounts for every level in the final projections. The final regression amounts I used were based on a larger sample of historical major league data: 122 batted ball events for HR/BBE; 65 PA for K%, and 159 PA for BB% (plus additional regression amounts for the other component statistics).
Figure 4. Regression amounts.
Note: Plate appearances for BB%, K%, batted ball events for HR/BBE.
Lastly, I also account for park effects and weighted historical data by recency. To account for recency and weight more recent historical performance more heavily, I followed the 5/4/3 2023/2022/2021 MARCEL weights (although I go further into the past), which also minimize prediction error (for stolen base attempts, I weight more recent data even more heavily, however). It is also worth noting what I don’t account for: I don’t account for scouting reports, Statcast data, defensive value, draft slot, signing bonus, or pre-professional statistics. You should still account for these factors in your valuations, of course, and I hope to include additional information in the projections over time.
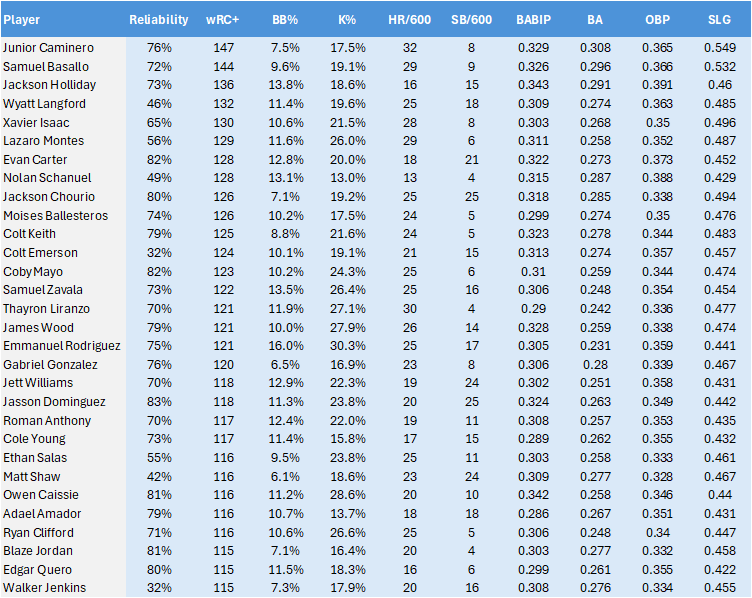
If you take each of these steps and put them together, Figure 5 shows what the final output looks like, ranking the best hitting prospects in the game by peak projected MLB wRC+ (with “prospects” at less than 130 MLB AB entering 2024). Although the prospects in this table are ranked by peak projected wRC+, I also show other peak projected statistics to help the reader formulate more fantasy-relevant expectations. I wanted to go more in-depth into the methodology in this article and it’s already getting lengthy, so I’ll conclude by simply pointing out that this list contains lots of familiar names that also feature prominently at the top of more traditional lists. This triangulation across related constructs lends confidence to my approach, and anyway, my rookie projections have performed well enough when compared to other prominent systems.
Figure 5. The Top 30 Hitting Prospects by Peak Projected MLB wRC+
Your delay is forgiven. This is incredible analysis, will you adjust the spreadsheet at certain points throughout the season?
thanks haha…it is adjusted regularly at scout the statline & prospects live…will use the projections for periodic updates here as well!
Would reviewing past season’s top prospect be possible? I’m curious to see how it would predict the guys that have recently graduated.
If you have a few names in mind , i can share their peak projected wrc+s
I for one am very curious about Heston Kjerstad! (Incredible work btw)
kjerstad’s is at a 106 peak wRC+ right now…he would be #1 only focusing on this year. 106 likely underrates him as his statcast metrics (barrel rate, etc) were much better than his actual home run rates in the past, but I don’t yet account for that. thanks!
Addison Barger?
TY!
his peak wrc+ projection is currently 94 🙂