The Game is Getting Younger, Is the Fantasy Value Following?
Big bases, a faster pace, and younger stars might be the way we summarize the 2023 season. There was a time, not so long ago when service time manipulation would hold players down in AAA for longer than they needed to be. While that is still possible, Michael Bauman reported, back in March, on the new CBA and how it incentivizes teams for calling up players to the big leagues earlier than in years past. It seems to be truly working in 2023.
If you were to simply look at the count of batters 22 years of age and younger who appeared in the last three seasons through July 6th, you might assume young player appearances are trending down early in the year.
Number of players age 22 or younger, no PA qualifier, through July 6th:
2021 – 24
2022 – 20
2023 – 18
But, add in a plate appearance qualifier, and your viewpoint may change. So far this season, there have been 13 players 22 years of age or younger that have made at least 100 plate appearances. That number, compared to five players in 2021 and 10 players in 2022, through July 6th in both seasons, is growing.
In order to make more of an apples-to-apples comparison, I’ve subset the 2021 and 2022 seasons down to all hitter stats through July 6th. This is still not a pure apples-to-apples comparison because of the delayed start in 2022 and the slow start for many players following the shortened pandemic season. However, the visual below still shows some interesting trends:
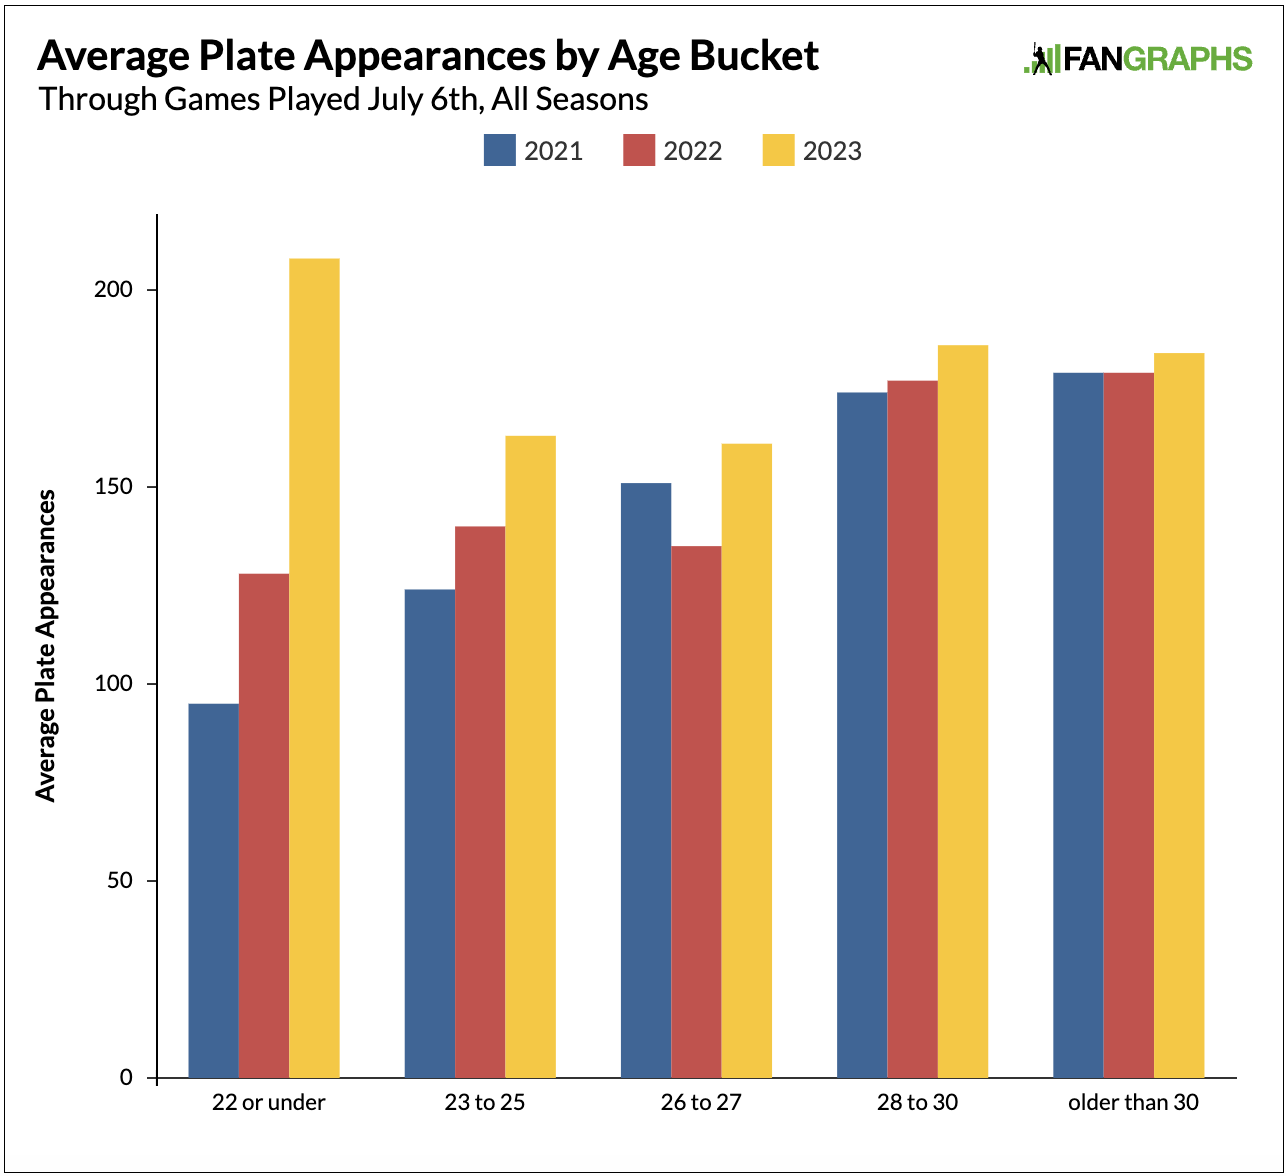
First, plate appearances are up in 2023 compared to the last two seasons as a whole. That makes sense when comparing 2023 to the delayed 2022 season, but I’m not exactly sure why the average within each group is so much higher in 2023 compared to 2021. My guess is that it was pandemic related. Regardless, if you just focus on the yellow bars representing the 2023 season, you’ll notice that the “22 or under” group is leading the charge. Remember that this is data in each season through July 6th and many young players make their debuts later in the season.
What’s telling here is that younger players are getting a jump on plate appearances earlier in the year on average. There is also no plate appearance qualifier in this data, so it’s possible that injuries and quick promotion/demotion types of players are pulling down the averages in each bucket, but you could also say the opposite for players like Ezequiel Tovar, Wander Franco, and Corbin Carroll who have each accumulated over 300 plate appearances in 2023. Here’s the full list of “22 or under” players with at least 100 PAs in 2023:
| Name | Team | G | PA | HR | R | RBI | SB |
|---|---|---|---|---|---|---|---|
| Corbin Carroll | ARI | 83 | 335 | 18 | 61 | 46 | 24 |
| Elly De La Cruz | CIN | 27 | 122 | 4 | 25 | 15 | 12 |
| Riley Greene | DET | 52 | 224 | 5 | 29 | 18 | 6 |
| Gunnar Henderson | BAL | 76 | 292 | 13 | 42 | 35 | 5 |
| Wander Franco | TBR | 83 | 366 | 10 | 47 | 43 | 28 |
| Jordan Walker | STL | 48 | 189 | 7 | 18 | 24 | 3 |
| Zach Neto | LAA | 55 | 199 | 6 | 24 | 22 | 5 |
| Francisco Alvarez | NYM | 63 | 214 | 16 | 28 | 33 | 0 |
| Michael Harris II | ATL | 64 | 239 | 9 | 32 | 25 | 11 |
| Julio Rodríguez | SEA | 84 | 382 | 13 | 50 | 47 | 20 |
| Ezequiel Tovar | COL | 81 | 310 | 8 | 41 | 41 | 4 |
| Anthony Volpe | NYY | 88 | 327 | 12 | 37 | 31 | 16 |
| CJ Abrams | WSN | 78 | 289 | 7 | 34 | 34 | 11 |
This table shows the success stories, for the most part, because of the qualifier. The 2021 count might also be helping us understand why average plate appearances were down in 2021 as younger players were being brought up to fill in for injured everyday players, but that again is just a theory. As we can see in the bar chart above, the young players who are in the big leagues are staying there and being given the opportunity to accumulate more plate appearances.
Could that simply be a blip and the young player pool this season is unusually talented? I don’t think so. Take a look at how average WAR by age group has changed in the last three seasons:
| Age Group | 2021 | 2022 | 2023 |
|---|---|---|---|
| 22 or under | 0.4 | 0.4 | 1.2 |
| 23 to 25 | 0.3 | 0.5 | 0.5 |
| 26 to 27 | 0.4 | 0.3 | 0.5 |
| 28 to 30 | 0.5 | 0.7 | 0.7 |
| older than 30 | 0.5 | 0.4 | 0.4 |
WAR might not be the most telling or helpful from a fantasy perspective, but it does a good job of showing where overall talent is age-wise. The issue from a fantasy perspective is that young players are historically more volatile. They strike out a lot as they adapt to big-league pitching. They get sent back down to AAA when things go bad.
It takes time for them to solidify their role on a team. Those concerns stop us from drafting them pre-season. A perfect example of this in 2023 is Gunnar Henderson. The young Orioles prospect was highly sought after in draft season but faltered early on:
| Monthly | G | AB | PA | H | HR | R | RBI | SB | AVG |
|---|---|---|---|---|---|---|---|---|---|
| Mar/Apr | 23 | 74 | 92 | 14 | 2 | 15 | 4 | 1 | 0.189 |
| May | 27 | 80 | 92 | 17 | 3 | 13 | 10 | 1 | 0.213 |
| Jun | 20 | 75 | 79 | 24 | 6 | 10 | 16 | 3 | 0.320 |
Had you drafted Gunnar this season you may have been considering a drop in May.
“What if he gets sent back down to AAA?”, you may have worried. “How am I going to make up that batting average?”, you could have thought. These would have been justifiable concerns. But things are changing. Players in this “22 or younger” age bucket are being given a little extra leash. Many of them are showing out and it shows from a value perspective. Let’s look at the average dollar value accumulated so far this season compared to the full 2021 and 2022 seasons:

Once again, we’re unable to make a true comparison as I cannot splice down the YTD auction calculator values by time period, however, we can see how each group compares to one another and whether they are on track to meet previous years’ mark. I did limit this dataset to players who performed better than -2 dollars in order to pull out poor performers and players who did not accumulate much playing time.
While that will eliminate injured and poor-performing players who stuck around, one thing is for sure, the younger group in 2023 has some work to do to get back to winning the age group battle, but they are the defending champions in the past two full seasons. If you look at the average value accumulation in 2021 and 2022, the young bucks thrived. Let’s go back and look at the players 22 or younger in 2023 who have accumulated less than 100 plate appearances to see if this group may get a boost:
| Name | Team | G | PA | HR | R | RBI | SB |
|---|---|---|---|---|---|---|---|
| Jordan Diaz | OAK | 29 | 90 | 5 | 9 | 10 | 0 |
| Luis Matos | SFG | 19 | 73 | 1 | 11 | 4 | 2 |
| Vaughn Grissom | ATL | 19 | 70 | 0 | 5 | 7 | 0 |
| Brayan Rocchio | CLE | 4 | 14 | 0 | 0 | 1 | 0 |
| Jose Rodriguez | CHW | 1 | 0 | 0 | 1 | 0 | 0 |
While there certainly are some bright futures in the above table, it’s hard to say whether or not they will provide the boost needed to get the 22 and unders back on track to dominating the value block again. No, it will likely need to come from better performances and health from those young players who have already solidified themselves as stars. If there’s one thing for fantasy managers to take from this analysis, it’s that the game is getting younger and so is the talent. While many managers latch on to the excitement and promise of the youth, others have been hesitant for reasons previously outlined. But perhaps some balance between the two theories is necessary. After all, the young players are the ones accumulating value and you don’t want to miss out.