Somedays You Have It And Somedays You Don’t: Robbie Ray’s Slider
It has always been difficult for me to understand pitcher volatility. Well, the volatility part isn’t hard to understand, actually, it’s very simple. Pitching in the big leagues is incredibly difficult and one tiny little element of a pitcher’s game could be off to make the whole outing unravel. But, what is hard to understand is what little element that is. Did a 1 mph drop on a four-seamer really make it all go south? Or, was it a matter of half an inch of location? Is it even measurable? Like, what if it was just bad gas from the previous night’s chimichanga that threw things off? Do you see where I’m going? I want to know why a pitcher does so well one day and so poorly the next. For my first round of this, I’ll start slow and focus on only one pitch, narrowing the question down to, why does one pitch perform well one day and bad the next? In today’s investigation, I’ll analyze and compare Robbie Ray’s July 3rd 2.6 wSL Pval (Pitch Info) with his July 24th -3.4 wSL pVal. Let’s have some fun.
Robbie Ray’s Game Log Page (sorted by wSL)
The Good: July 3rd, 2022: Oakland Athletics @ Seattle Mariners:
6.2 innings, four hits, one earned run on a home run (4-seamer), 12 strikeouts.
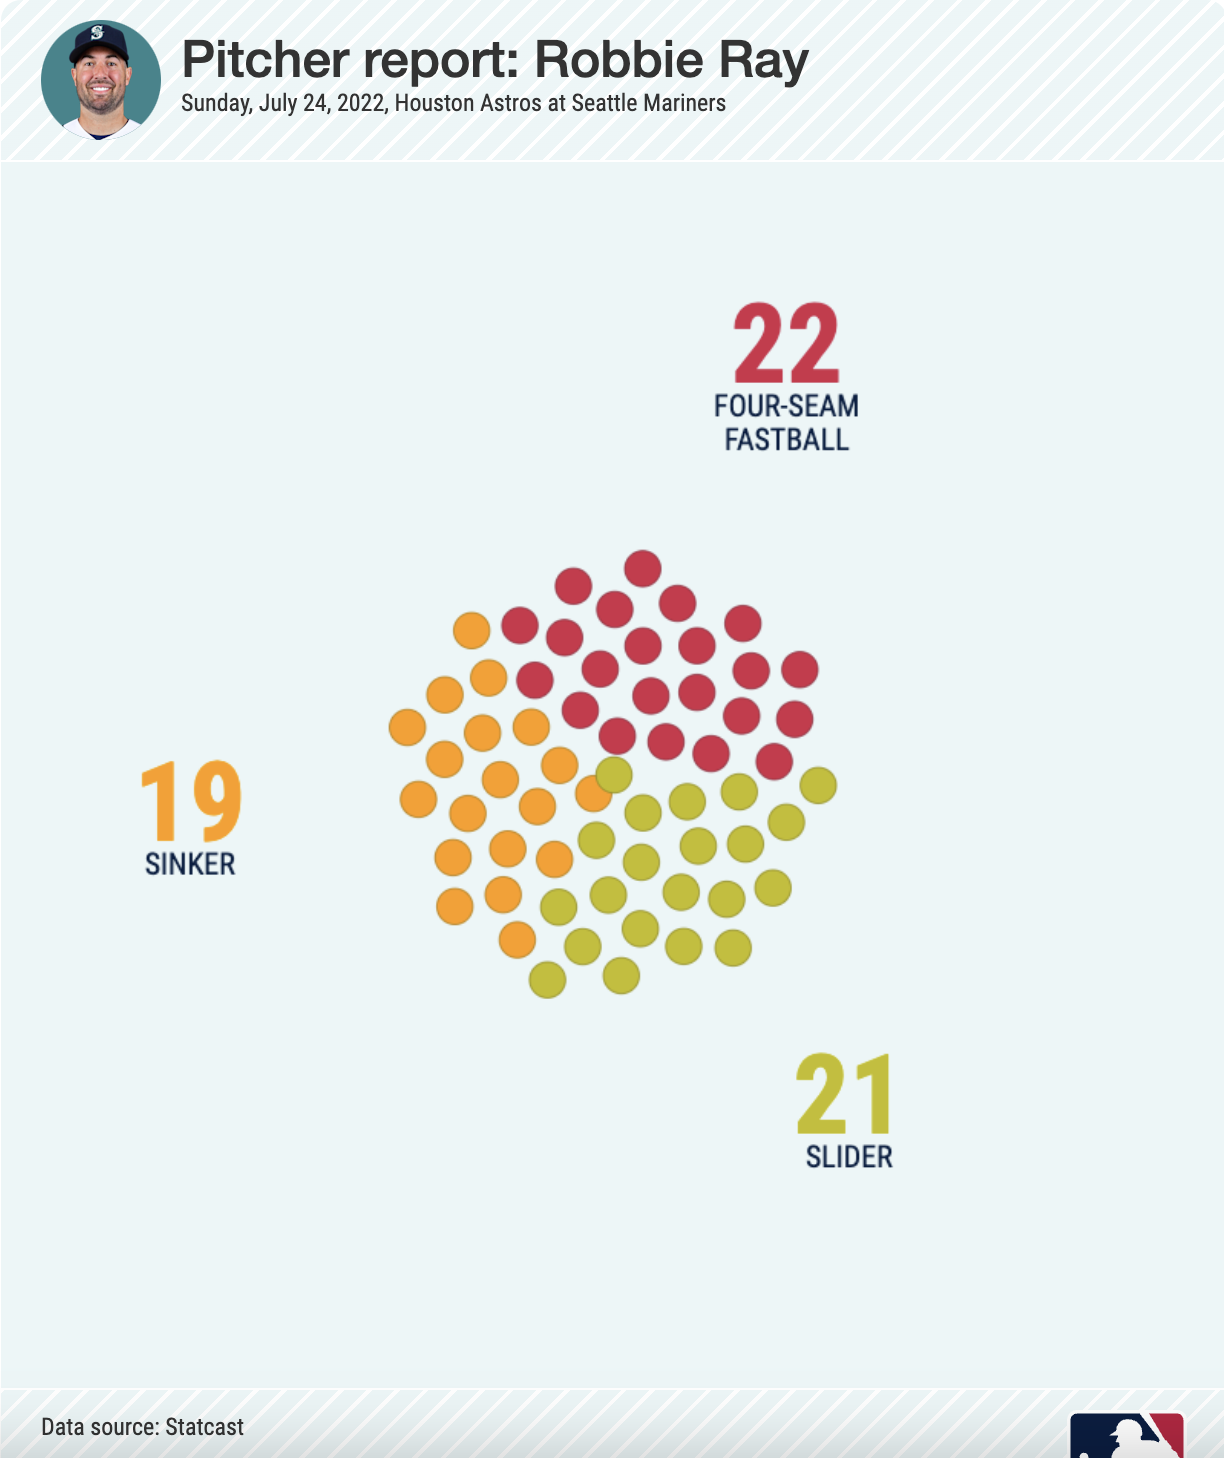
Ray threw 51 sliders for a pVal accumulation of 2.6 points. He threw the pitch 48% overall and here’s how he distributed all of his pitches:
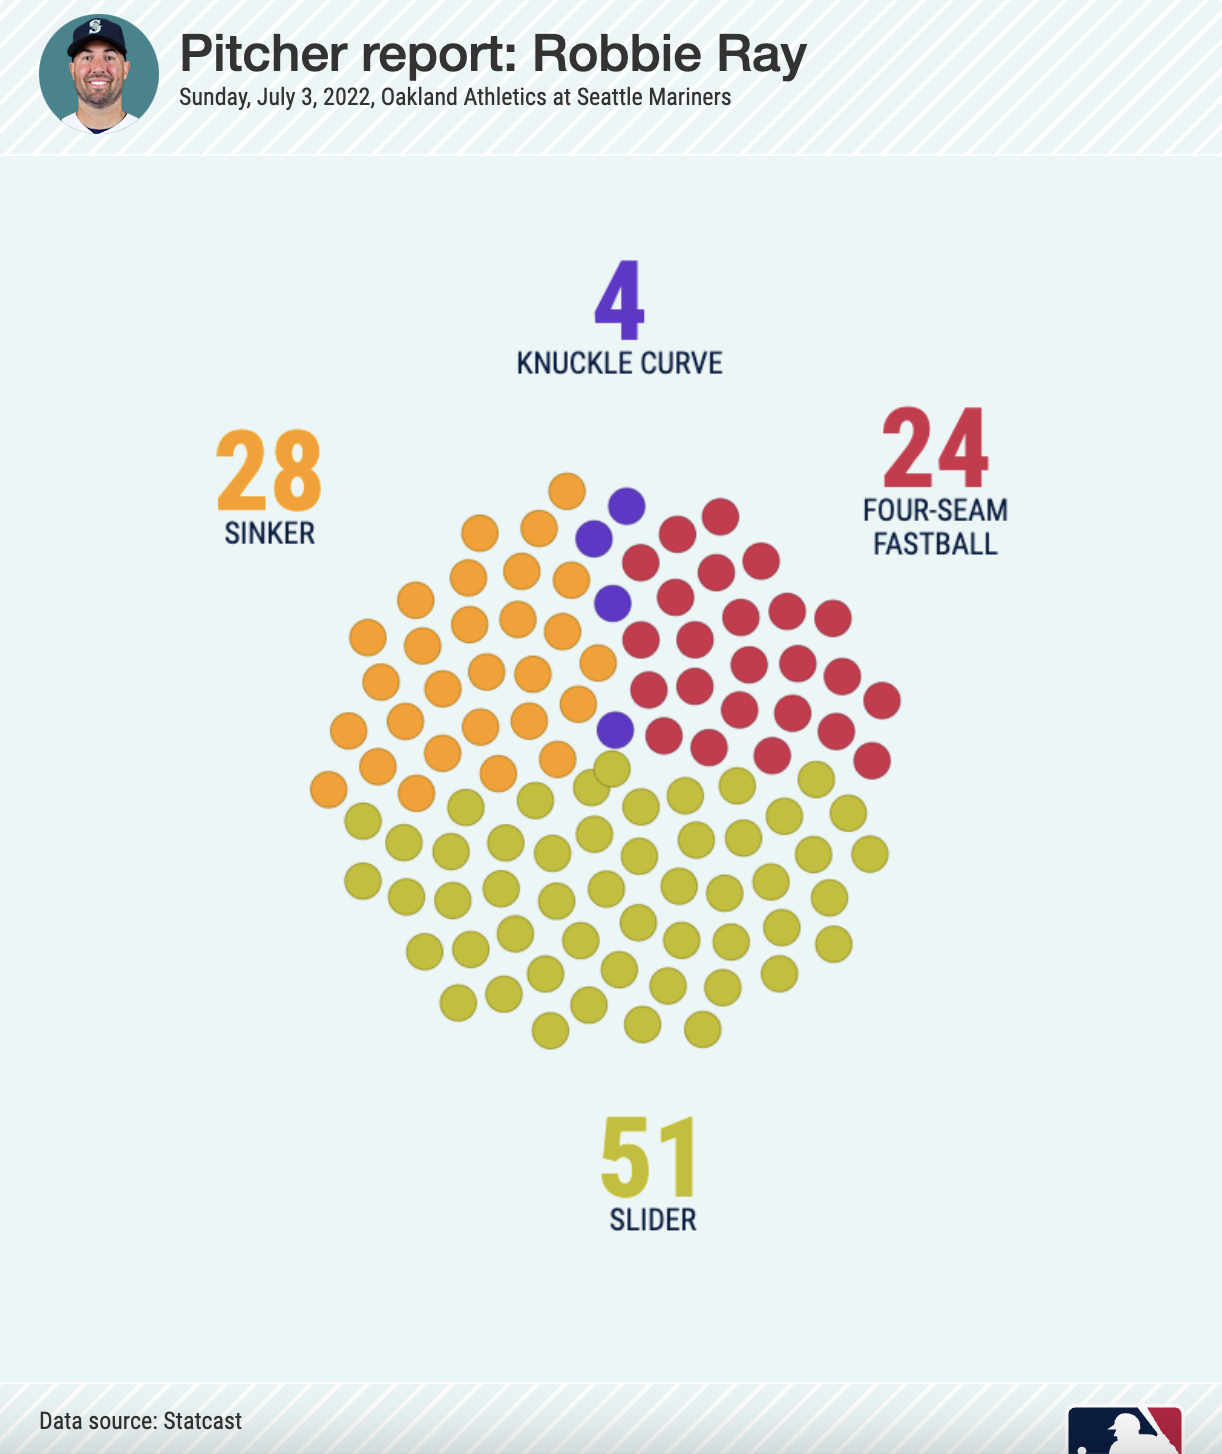
That’s a good pVal score on the slider, but the rest of his game was working well. He was pulled after the home run was given up so it’s possible that fatigue caught up to him. Let’s stick to the plan and only focus on the slider. Here’s the savant outcome chart for all his sliders that ended an at-bat:
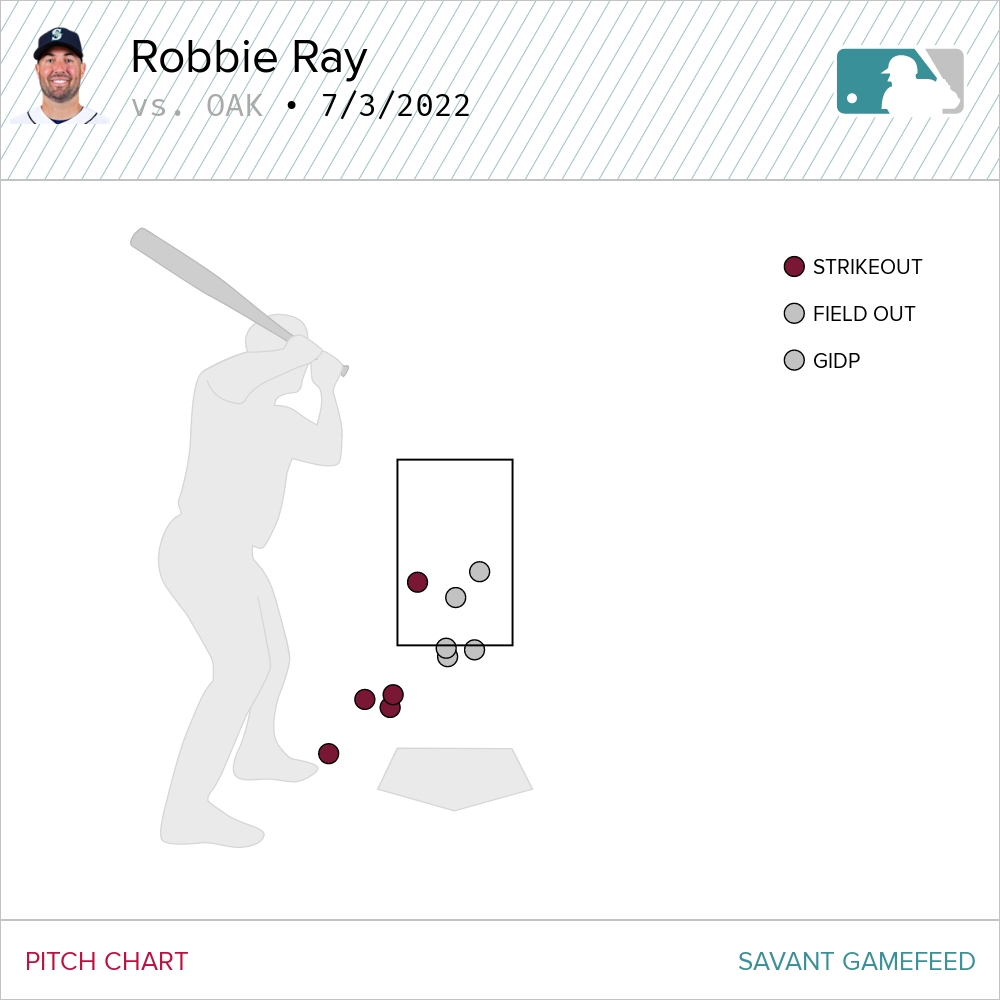
Ray just loves to throw that slider down and in to right-handed hitters. While it may seem odd for a left-handed pitcher to throw so many sliders down and in to right-handed batters, it’s not unusual in today’s game. The percentages vary widely depending on where you go to find the information, but the best leaderboard I could find was on Pitcher List. Here are the top five left-handed starting pitchers (min. 150 IP) by slider usage to right-handed batters:
| Name | P Count | MPH | Usage% | SwStr% | CS% | CSW% |
|---|---|---|---|---|---|---|
| Clayton Kershaw | 653 | 86.6 | 35.5% | 23.4% | 9.2% | 32.6% |
| Kyle Nelson | 208 | 84.4 | 35.1% | 17.3% | 9.6% | 26.9% |
| Tucker Davidson | 293 | 86.8 | 32.1% | 16.0% | 15.4% | 31.4% |
| Robbie Ray | 896 | 87.1 | 29.4% | 19.6% | 11.2% | 30.8% |
| Alex Wood | 604 | 84.4 | 27.0% | 13.7% | 16.4% | 30.1% |
As it turns out Ray didn’t even face a left-handed hitter in this game against the Athletics. Ray’s SwStr% on the slider for the day was above his average at 21.6%, garnering 11 whiffs on 51 sliders thrown. Here’s a visual:
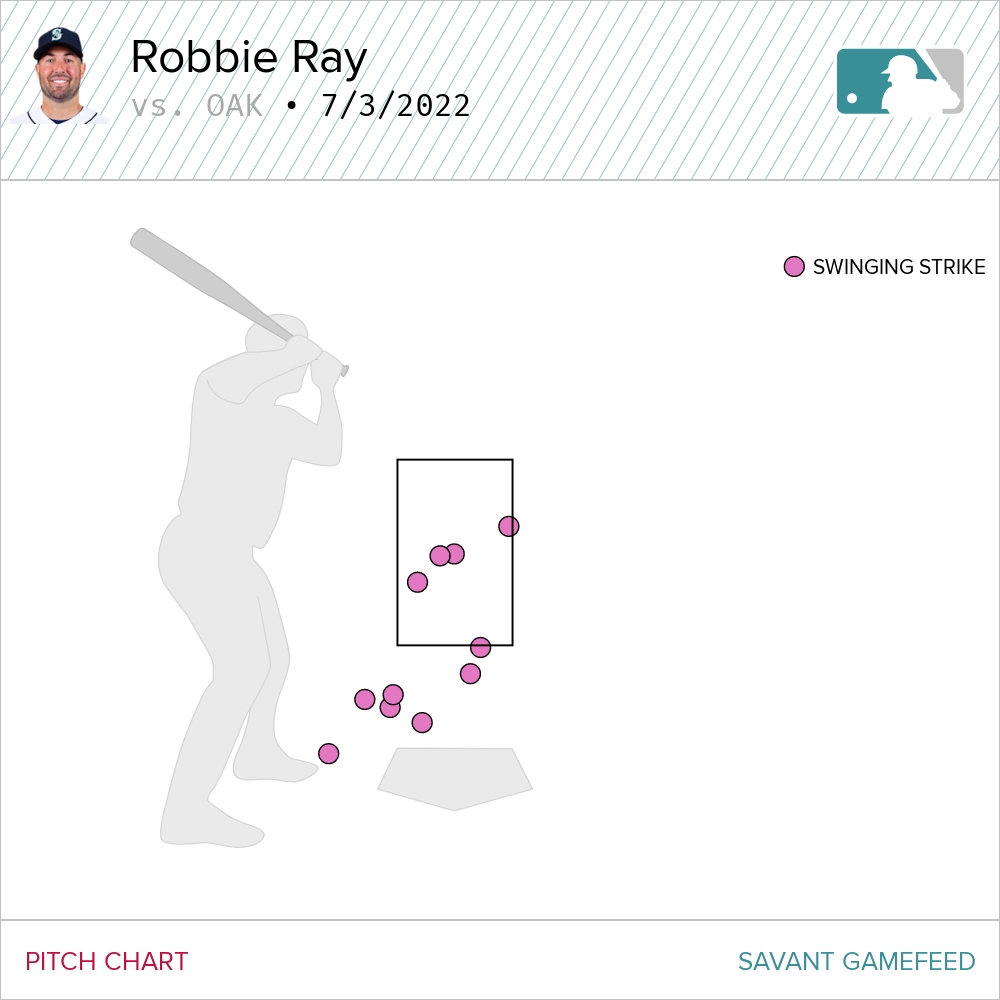
It’s pretty wild to see those sliders just hanging there in the center of the zone. Let’s watch one:
It’s a good looking pitch and it just sort of hangs there. When Ray has a four-seamer to place in the top of the zone, hitters are kept on their toes. All in all against the Athletics, Ray’s slider was great. Here’s an overall summary:
| Avg Pitch Velocity | Avg Spin | Avg Vertical Break | Avg Horizontal Break | Count | Sw% | CSW% |
|---|---|---|---|---|---|---|
| 86.7 | 2214 | 27 | 1 | 51 | 41 | 35 |
–
The Bad: July 24th, 2022: Houston Astros @ Seattle Mariners:
3 innings, 10 hits, six earned runs with two home runs (sinker and slider), and one strikeout.
Ray threw 11 sliders for a pVal accumulation of -3.4 points. He threw the pitch 34% overall and here’s how he distributed all of his pitches:
Right away we can see that he cut back on the slider usage. Ray opened the game with a low, what I thought was well placed, sinker that got smoked by Jose Altuve. Did that unexpected start, even though it was Altuve, affect Ray’s game? Well, it was a sinker, not a slider, so we can’t directly analyze it’s impact. Here’s what happened to Ray’s sliders thrown to righties:
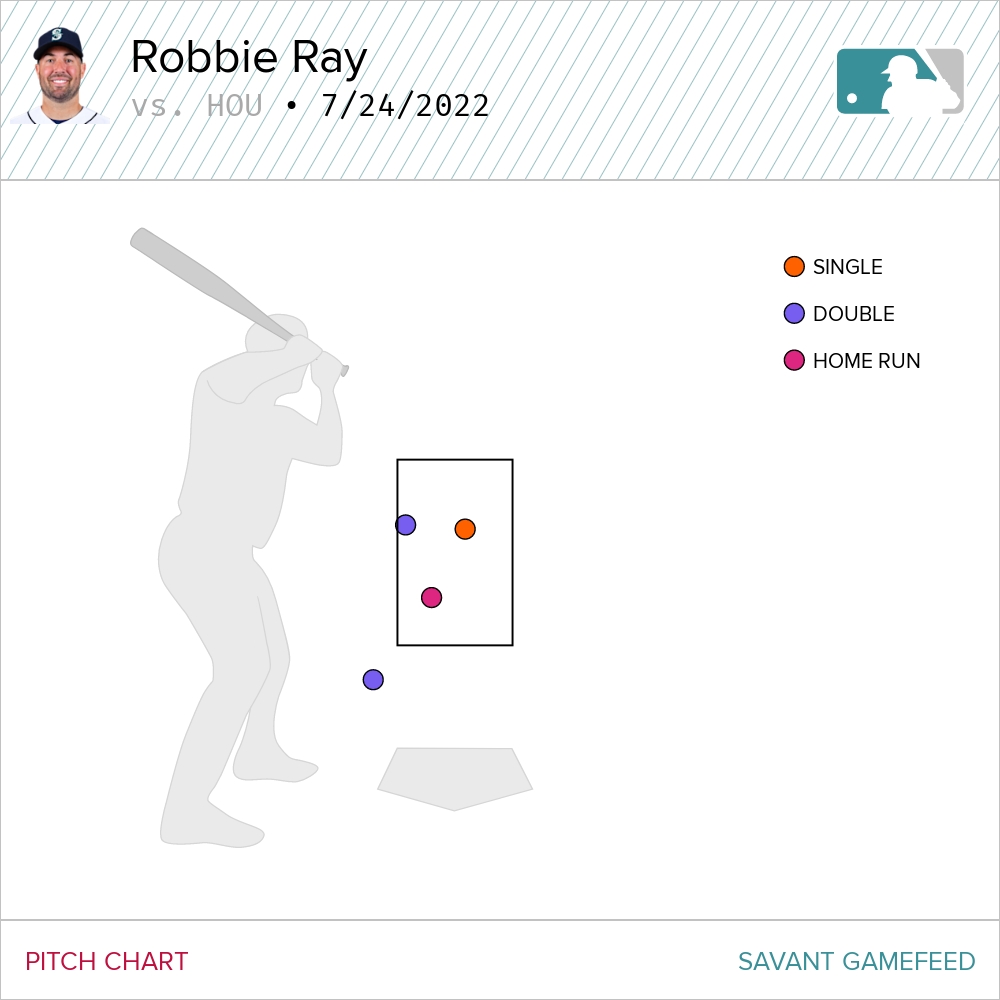
Against the Athletics, Ray’s slider went unhit. Against the Astros, well, it got hit. Ray did face a left-handed hitter, Kyle Tucker, in this game against the Astros and he did throw Tucker sliders, but none of those pitches ended an at-bat. They were located well, but Tucker was able to either make contact or successfully take the pitch.
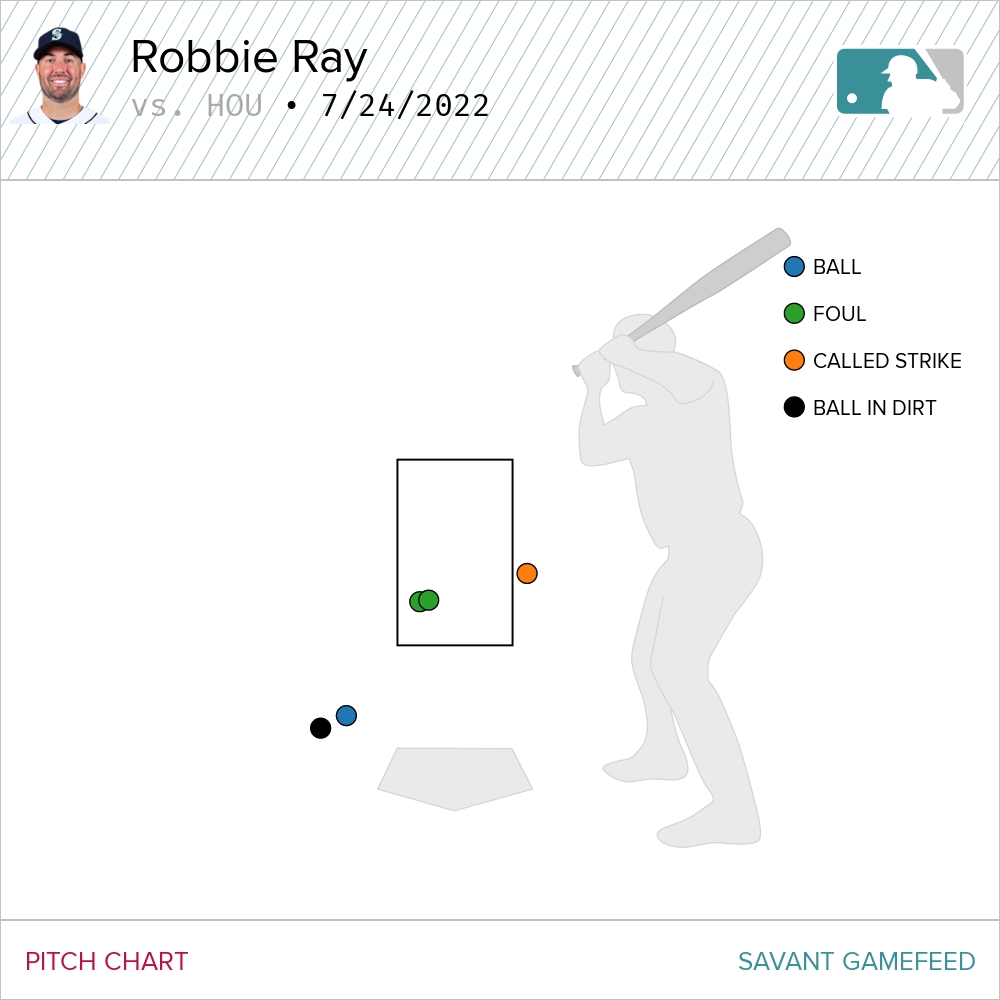
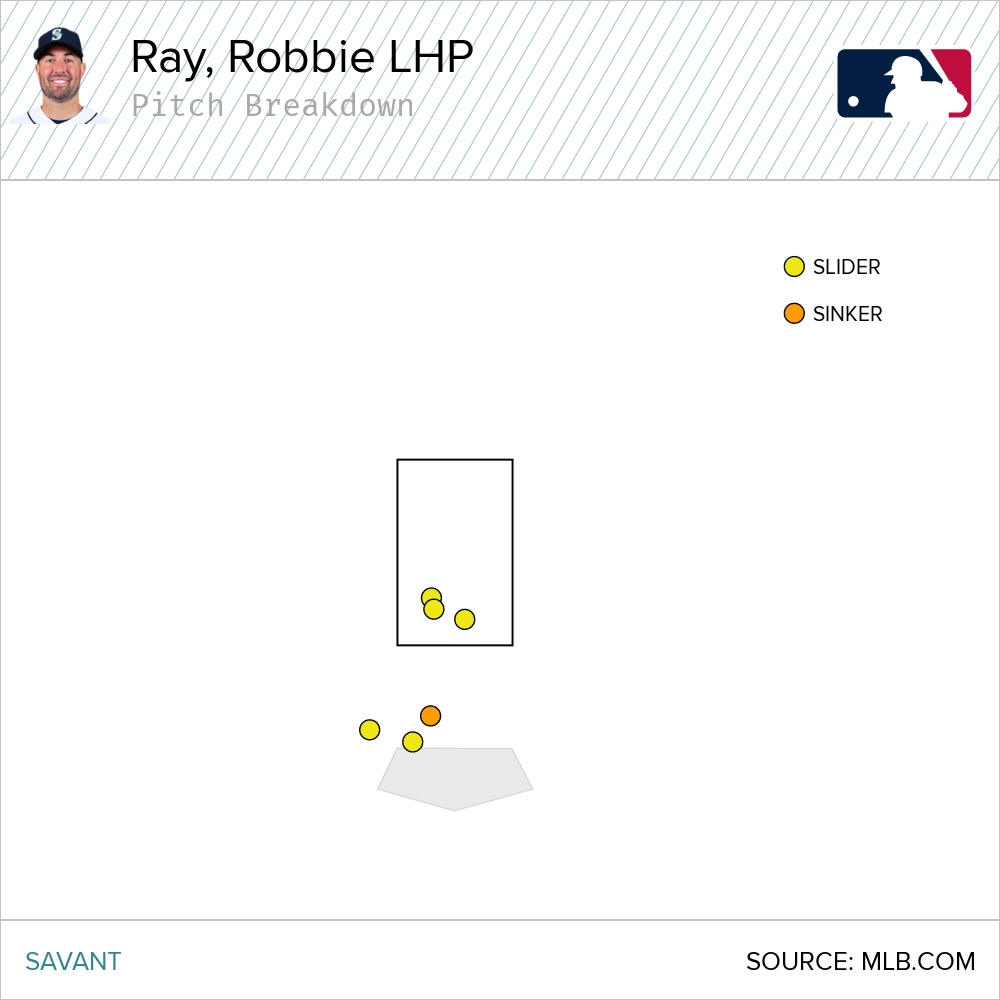
No, it wasn’t Tucker the lefty who did the damage. It was the righties. Two doubles, a single and a home run can tank your pVal for the day and when there aren’t any good things that happen to it there’s no way to get the points out of the basement level. Remember the image from the A’s game with all those pink swinging-strike dots in the heart of the zone? The Astros didn’t make any of those. He did get three called strikes on sliders that were very well placed:
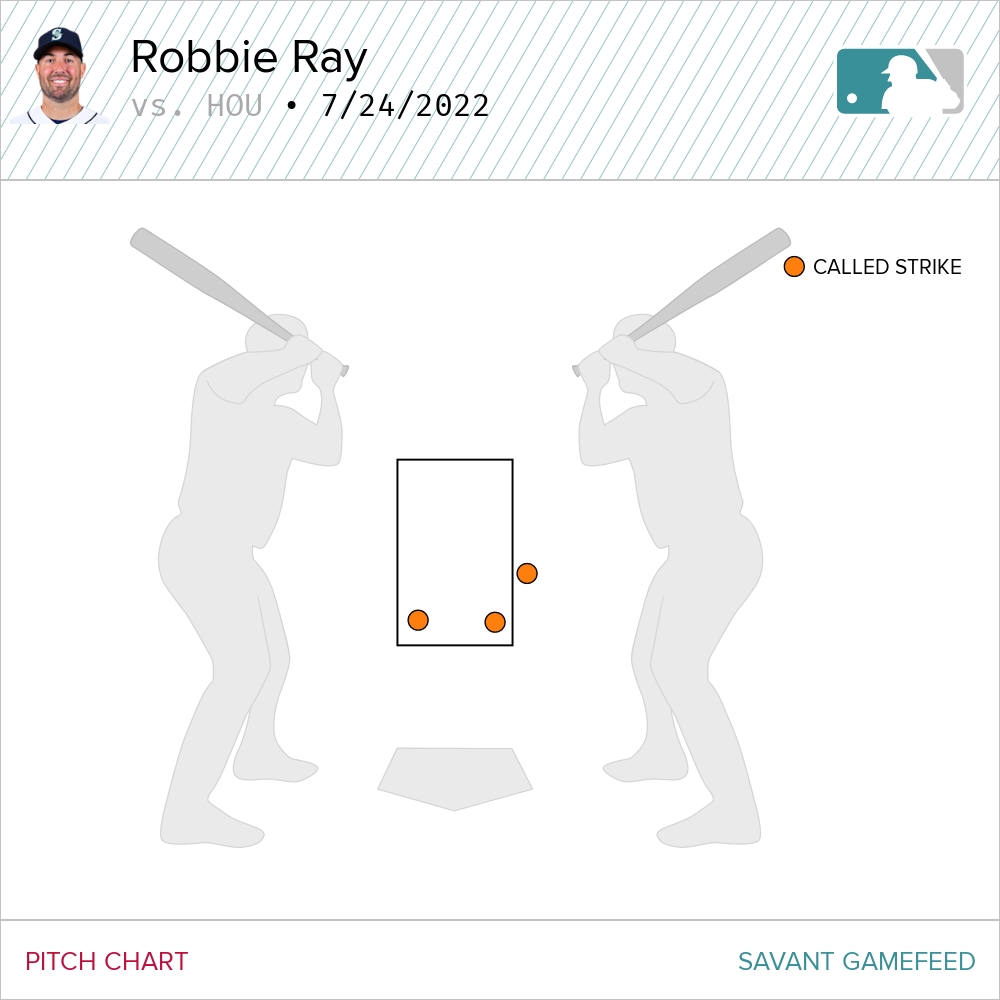
If those two low in the zone called strikes were low enough to deceive hitters, this one wasn’t:
In this at-bat, the at-bat directly after the Altuve home run, Ray threw one sinker for a ball to start the at-bat and then threw five consecutive sliders and the fifth was put out. From that it wouldn’t seem that the Altuve home run made Ray abandon his slider, but it certainly slowed in usage after the Pena at-bat:
So the Astros hitters were just better, is that it? Well, yes. In 2022 Oakland’s team wSL was a league worst -93.4. The Astros fell smack-dab in the middle of the MLB with a -10.1 mark. The best team? The St. Louis Cardinals crushed sliders in 2022 with a 22.9 wSL. So, there’s one theory. The Astros were just better and weren’t going to leave any sliders hanging in the zone.
| Avg Pitch Velocity | Avg Spin | Avg Vertical Break | Avg Horizontal Break | Count | Sw% | CSW% |
|---|---|---|---|---|---|---|
| 87.3 | 2273 | 27 | 1 | 21 | 0 | 14 |
–
The Conclusion
Notice how Ray’s slider performed exactly the same across games from a vertical and horizontal movement standpoint. That’s savants measurement but even if we switch over to Brooks Baseball data to compare pitch qualities, we see similar things. Here’s a comparison on how the slider performed across these two games:
| Game | Avg Speed | Max Speed | Avg H-Break | Avg V-Break | Count | Called Strikes | Swinging Strikes |
|---|---|---|---|---|---|---|---|
| July 3rd, Oakland @ Mariners | 86.5 | 88.8 | -0.9 | 4.26 | 51 | 7 | 11 |
| July 24th, Astros @ Mariners | 86.8 | 89.5 | -0.83 | 3.44 | 21 | 3 | 0 |
I don’t think that vertical break difference is enough make a big impact but it might be. The difference is really in the way Brooks (pitch info) and Savant (statcast) measure break. Savant gives more distance to measure than does Brooks, so the savant measurements are larger, having more time/distance to level out. No, it seems that the slider was moving about the same between the two days. I think it’s much more simple than the deep physical traits that make a pitch. Ray faced tougher hitters and left too many sliders in the zone.
| Zone% | Z-Swing% | O-Swing% | |
|---|---|---|---|
| July 3rd, Oakland @ Mariners | 45 | 74 | 36 |
| July 24th, Astros @ Mariners | 48 | 80 | 9 |
My conclusion? Somedays you have it and somedays you don’t and advanced scouting is good. Surely the Astros were ready to see a lot of sliders down and in to right-handers and if that’s what they were looking for, just imagine how tasty one a little further up in the zone would look. This, in essence, is the most complicated part of playing fantasy baseball; trying to predict and catch this before it happens. Had you started Ray against the A’s and reaped the benefits of that stellar outing, you were probably riding high and didn’t even think to quesiton his next start. But, if you did, and you made that micro-level decision/analysis, you rule. Just try to do it again.
I like your new spelling of Seattle.