Projected Counting Stat Distributions by Position
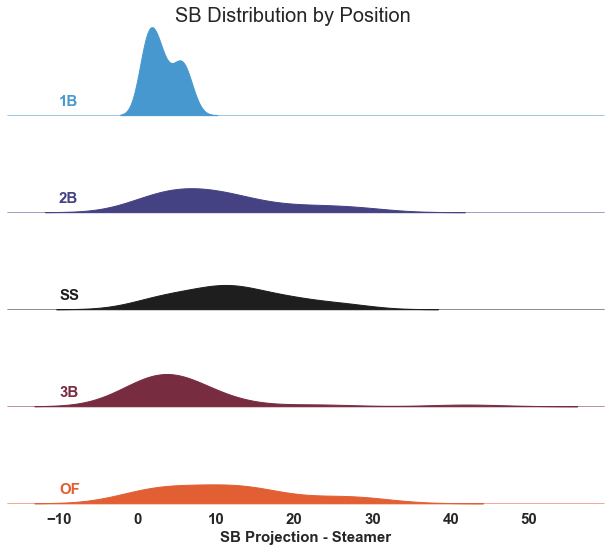
In last week’s post, I included a visualization that showed the distribution of projected counting stats by position so that fantasy managers can prepare for drafts. Here’s the example of stolen bases I presented last week:
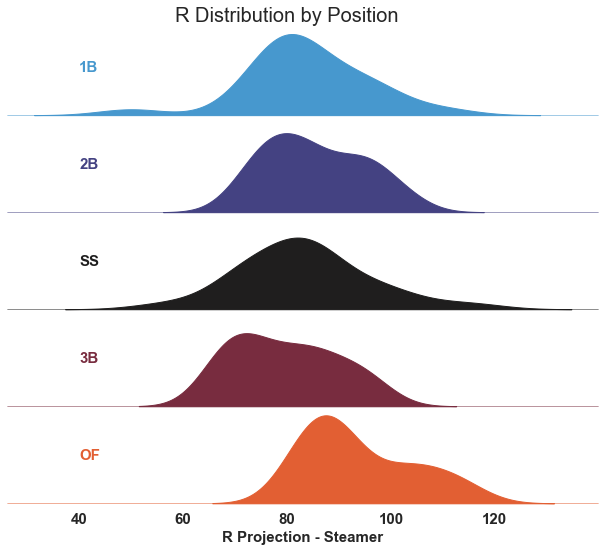
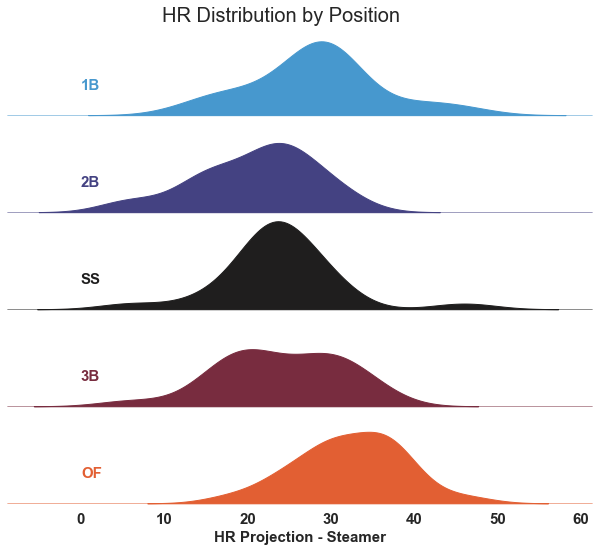
If you’d like to click through versions of this visual for runs, rbi, and home runs, click HERE or just scroll to the bottom of the post.
See that little tiny bump at the 3B position around 40? That’s Adalberto Mondesi’s projection. Otherwise, this visual shows you that the majority of draftable third basemen will accumulate anywhere from zero to 10 stolen bases. Try not to pay too much attention to the fact that these KDE plots show negative numbers. The 3B KDE peaks at two stolen bases because there are six individual third basemen projected to steal two bases. The KDE smooths out the tails to match the distribution, rather than cutting off at the left-most or right-most bins like a histogram.
Managers can utilize these charts by noticing which positions give the most potential for stolen bases and how large your window will be for drafting those skills. For example, let’s say you’ve made it to the fourth round of your draft, you are light on stolen bases, and you have to choose between filling first base and second base. Looking at this visual will tell you that there’s a nice little group of second basemen who are projected to provide between 20 and 30 stolen bases. You should grab one of those. First basemen won’t provide much in the way of stolen bases.
For each of these visuals, the player pool was created by running the default settings of the auction calculator and including the top 24 players at each position according to dollar value. Hopefully, you find these useful for planning out your draft strategy.

The link to the other categories goes to a page that says this: “Only logged in creator can see the draft.”
Dang. Ok, thanks for the flag. I’ll fix that now.