Ottoneu: Where Auction Price Is Just a Concept
What is fantasy baseball money anyways? It’s made up, monopoly money, fake, and not tied to any real financial logical thinking. If I want to pay Mike Trout $75, I’ll do it. So long as no one in my league wants to pay him $76. It’s in my rights as an Ottoneu player. Some people pull up to the closest gas station they can find, don’t even look at the price per gallon, pump away and jam the “No” button when asked, “Do you want a receipt?” Others drive around for miles waiting to find that station showing a $0.05 lower price than all the rest, print that receipt, stuff it in their wallet, and keep it for proof of the deal they got to show their neighbors at a later date. What I’m really trying to get at here is that the price you pay can be entirely different than the price someone else is willing to pay and this is really what playing in fantasy baseball auction leagues is all about.
Click over to the auction calculator, set it to Ottoneu FanGraphs points league scoring, and take a look at Aaron Judge’s 2022 year-to-date (YTD) value. $93! That’s 1458.2 points worth of one outfielder. Starting in 2018, the FanGraphs Staff II League champion typically accumulated a few hundred points above 18,500. For teams that rostered Judge in 2022 and came close to this point total, Judge represented roughly eight percent of their points total. But any manager who bid anywhere above $70 for Judge last season was likely ridiculed. While Judge’s current average (and median) salary in FanGraphs points leagues is $50, his value won’t be realized until the end of this season. Yes, the person who bid $70 for Aaron Judge this time last year came out on top, but did they cut him and send him back to re-draft this year? He’s valued by the auction calculator at $68.80 and that doesn’t include inflation.
So, who do you believe? Where do you look? How many of you have already stopped reading this and are currently typing in the comments section about how your valuation is the valuation? To be honest, I don’t know. What I do know is the auction calculator provides a good jumping-off point. If you really want to get a close estimate of what you should pay in an auction, you can plug in all the keepers in your league and it will help with controlling for inflation. I chose not to go through that process and instead added roughly 20% to a player’s salary to get a “Predicted Value”. Last week, our FanGraphs staff two league conducted its yearly re-draft. Here are the 10 players furthest from that prediction in the negative (Underpays) and the 10 players furthest from that prediction in the positive (Overpays):
| Name | Auction Calc Value | Predicted Value | Winning Bid | Diff |
|---|---|---|---|---|
| Christian Yelich | $29.40 | $35.29 | $20.00 | -$15.29 |
| José Abreu | $22.45 | $26.94 | $18.00 | -$8.94 |
| Mitch Haniger | $15.64 | $18.77 | $10.00 | -$8.77 |
| Mike Yastrzemski | $5.96 | $7.15 | $1.00 | -$6.15 |
| Paul Goldschmidt | $37.41 | $44.89 | $39.00 | -$5.89 |
| Mike Trout | $53.62 | $64.35 | $60.00 | -$4.35 |
| Javier Báez | $6.09 | $7.31 | $3.00 | -$4.31 |
| Rhys Hoskins | $21.09 | $25.31 | $21.00 | -$4.31 |
| Wil Myers | $5.83 | $6.99 | $3.00 | -$3.99 |
| Austin Hays | $3.86 | $4.64 | $1.00 | -$3.64 |
*Diff = Winning Bid – Predicted Value
–
| Name | Auction Calc Value | Predicted Value | Winning Bid | Diff |
|---|---|---|---|---|
| Jesse Winker | $2.60 | $3.12 | $23.00 | $19.88 |
| Ozzie Albies | $8.14 | $9.77 | $27.00 | $17.23 |
| DJ LeMahieu | $1.00 | $1.00 | $17.00 | $16.00 |
| Michael Brantley | $1.00 | $1.00 | $16.00 | $15.00 |
| Trevor Story | $1.00 | $1.00 | $12.00 | $11.00 |
| J.D. Martinez | $1.00 | $1.20 | $12.00 | $10.80 |
| Giancarlo Stanton | $17.66 | $21.20 | $31.00 | $9.80 |
| Dylan Carlson | $1.00 | $1.00 | $10.00 | $9.00 |
| Cody Bellinger | $1.00 | $1.00 | $9.00 | $8.00 |
| Spencer Steer | $1.00 | $1.00 | $9.00 | $8.00 |
*Diff = Winning Bid – Predicted Value
There will always be a few players whose final salary is way out of line with what we would expect. It happens in every draft and someone undoubtedly tweets about it looking for crowd-sourced justification that the price is out of line. But only showing you the highest and lowest differentials doesn’t do the predictions analysis justice. The graph below shows my average predictions versus the average actual winning bid (salary) by decile. The decile rank was created using the predicted value. Keep in mind that this is a re-draft, so the player pool is limited to the non-keeper, free agents.
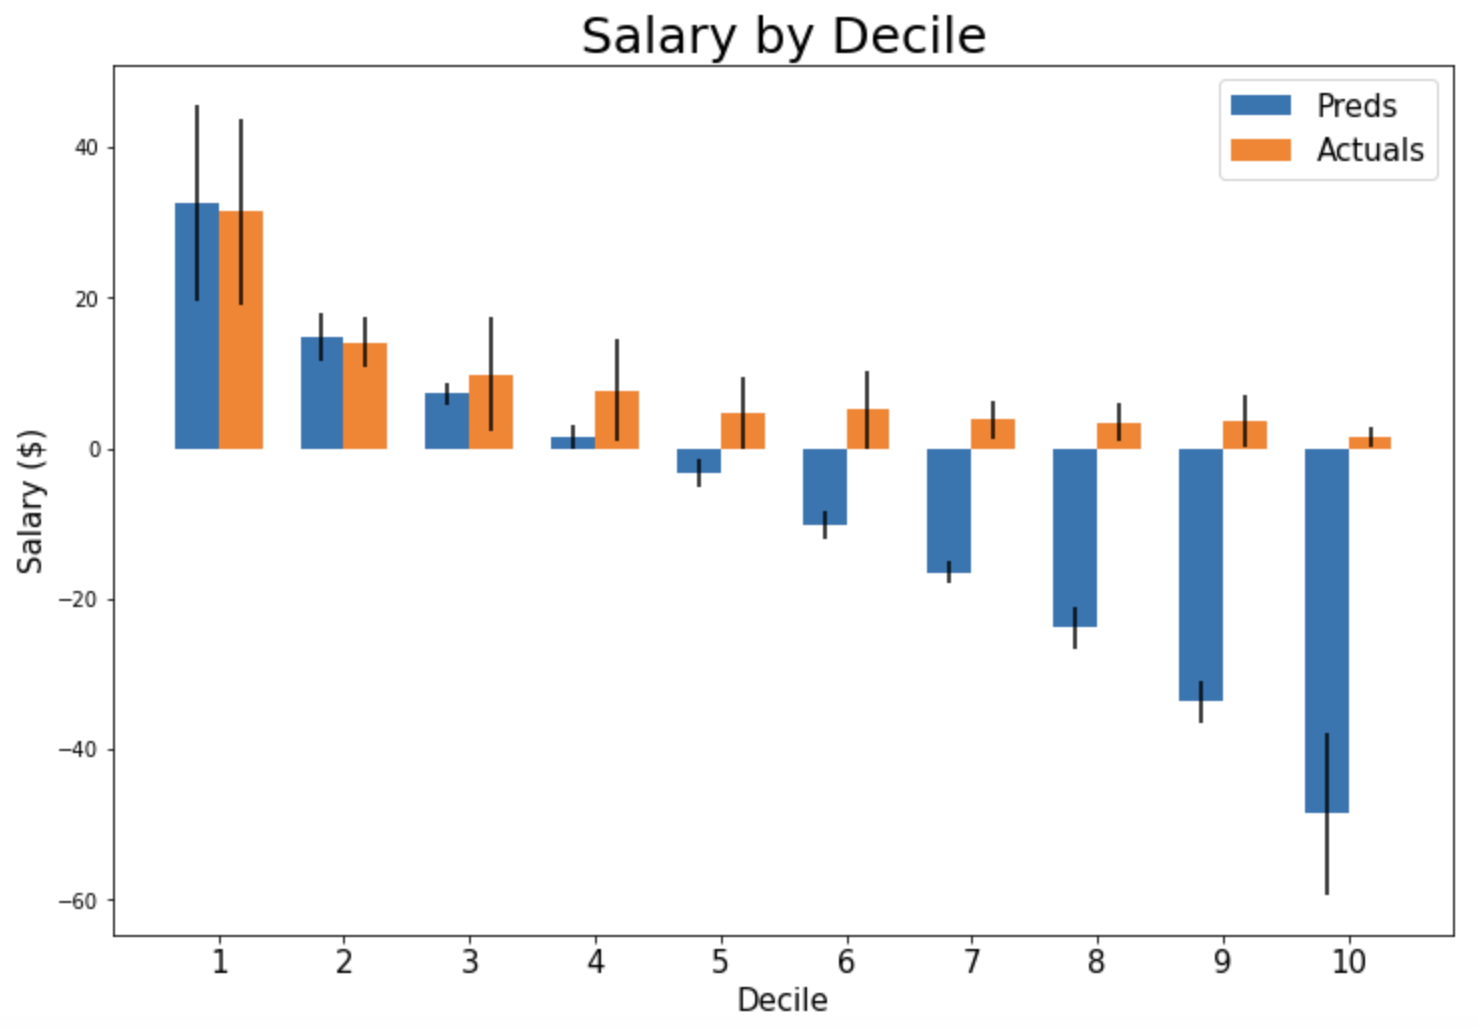
There are huge discrepancies from decile four onward because my predictions didn’t make negative players worth $1, but instead kept their negative price and, even worse, added negative value in my inflation calculation. This is not the way to do it but had I converted all these players to $1 the graph wouldn’t become any more informative because all the blue bars would average to $1. The way it is constructed now at least gives you a sense of how unlikely players in lower deciles are to actually return a positive value. With that explanation out of the way, we can see that deciles five, six, and nine have larger standard deviations in actuals, meaning drafters were willing to pay well over $1 in many cases. If this informs us of anything, it’s that in most leagues, a $1 player is difficult to define/value and it remains an area with huge potential for those who can come close to doing so.
Lastly, here are the average-squared error measurements of each valuation from this draft and this time, I’ve made all negative-value players worth $1. This is because in reality if my spreadsheet said player X was valued at -$13, but I disagreed, I would only bid $1.
Mean Squared Error (MSE):
AVERAGE((Actual Salary – Auction Calculated Value) ^ 2) = 34.1
AVERAGE((Actual Salary – Adjusted or Predicted Value) ^ 2) = 32.0
Remember that the Adjusted/Predicted Value, the blue bars in the graph above, were simply auction calculator values adjusted for inflation by adding 20%. Overall, these adjustments proved more accurate by MSE.
Adjusting for inflation, in this case, was a good move, but in the grand scheme of things it didn’t really make individual predictions that much better. Just look at Jesse Winker in the “Overpay” table above. Winker’s low game/PA projection places him just above replacement level with 590.6 projected points, but at 5.2 points per game. In other words, when you play him, he’ll be better than the average player but it’s unclear just how much he will play. If you take the under on playing time you’ll have a really valuable player that you can plug in and out of your lineup. If you take the over, that points per game number will start to go down, possibly finding him somewhere in-between those two points measurements with a higher total points but a lower points per game, making him, in my opinion, a much different player. Have I written myself into circles? Maybe. But, it’s all related to the fact that trying to find accurate valuation for players in Ottoneu leagues is a challenge. The key here is that all of these values, total points, points per game, adjusted for inflation values, are all based on projections and projections, by nature, are inaccurate.
Will we ever get closer to true auction values? Probably not and that’s what makes it so much fun. Is $10 a good price for Mitch Haniger? I think so. I’m the one who paid it. By my calculation I saved myself $8. But only the San Francisco Giants outfield and Hanigers’ ability to stay there will tell me whether I’m right or wrong.
Auction price is also a function of the dynamic of the auction and when the player is nominated. Nominate Jesse Winker in the first two rounds and his price will be high. If he falls to late in the auction, his price will be much lower.
Very true. The fact that Winker went for $23, while Yaz went for $1, *has* to be a round-bidding thing. Either that or a very enthusiastic Brewers fan is excited about their new addition to the outfield.