Ottoneu: Visualize Your Way To Success
Visualizations can give us better insight into our team’s performance, showing us aspects of the fantasy season that we hadn’t noticed of before. If you find yourself isolated to the merry-go-round of benching, starting, and looking at current auctions when it comes to in-season management, you’re likely missing something. Ottoneu has so many moving parts, so many extra subtleties that play a role in putting together a successful season. In this post, I’ll remind you of the great pre-made visualizations Ottoneu offers and I’ll give a few examples of how to effectively use them.
Viz #1: Pace and Limits
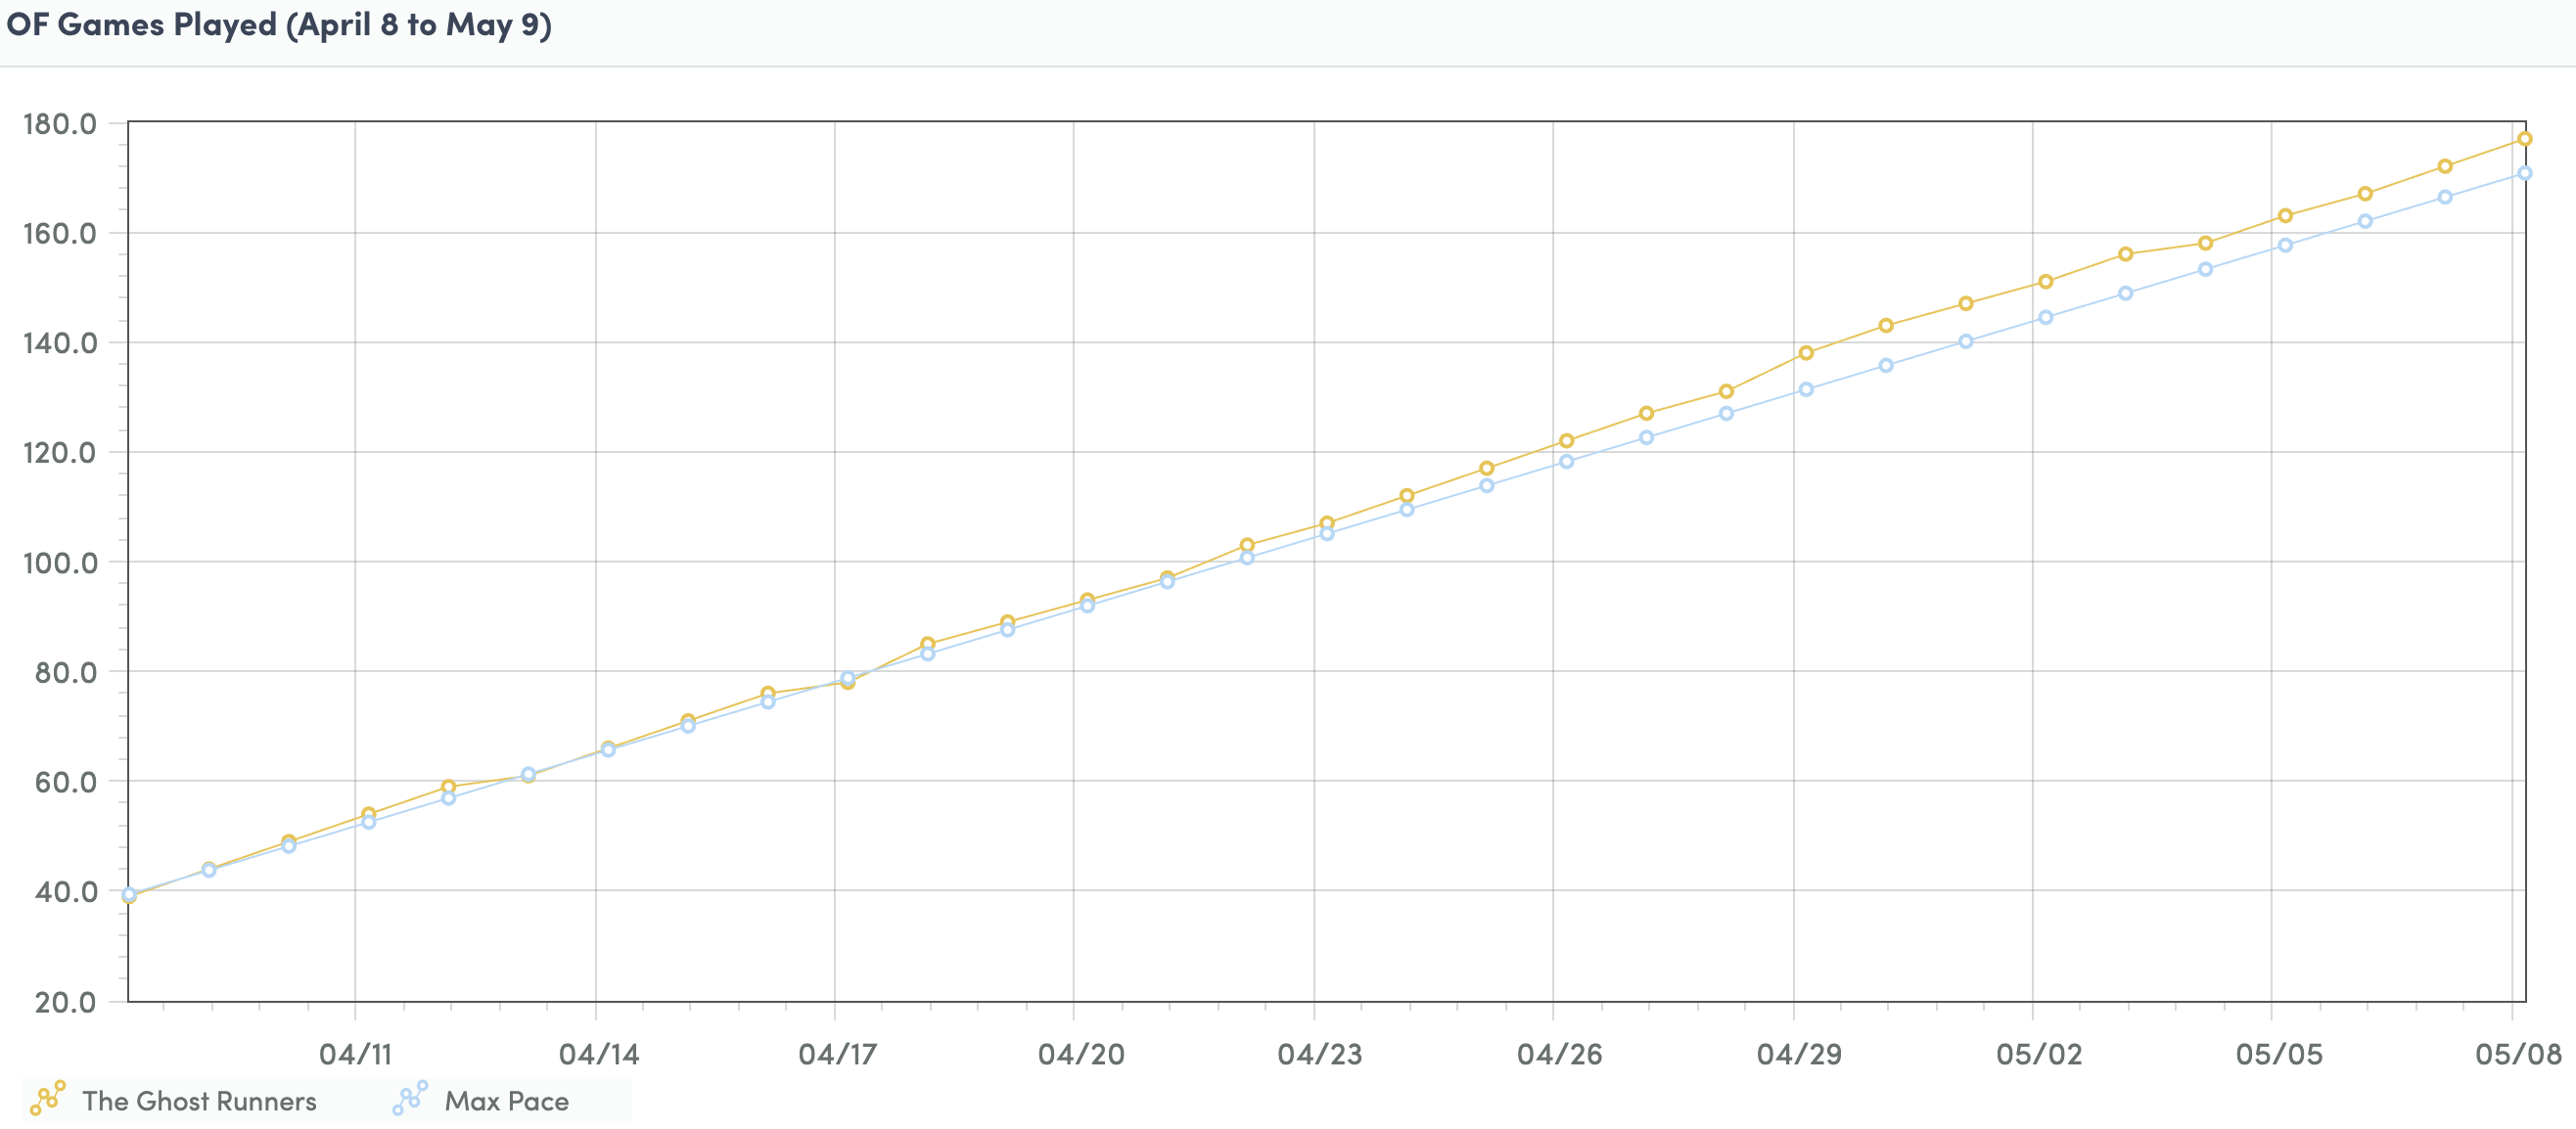
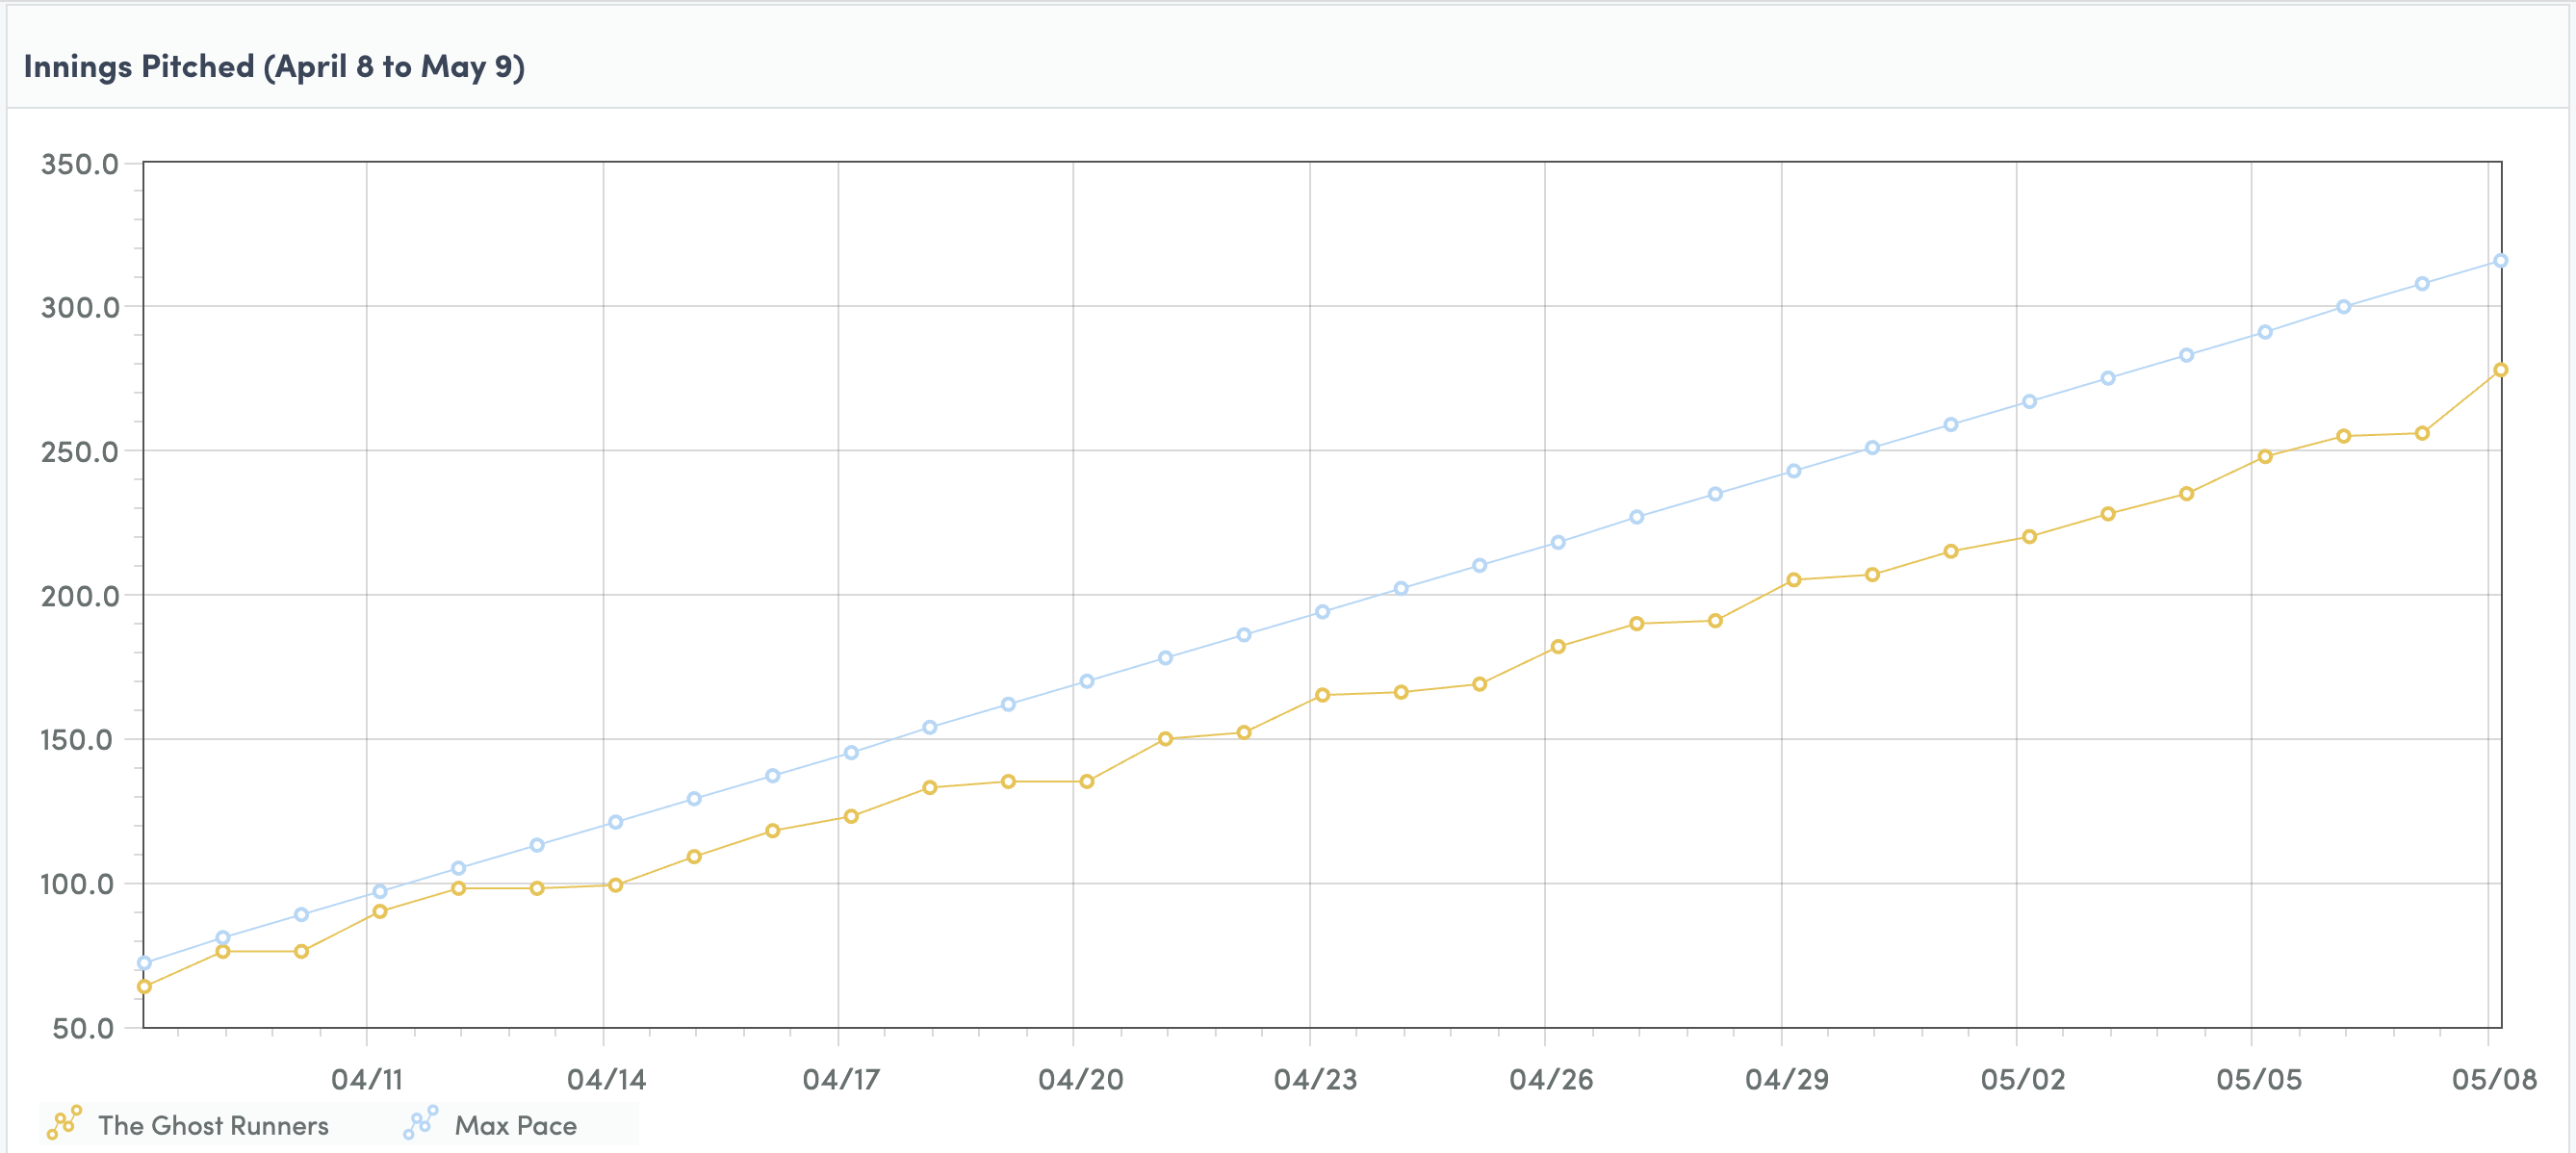
The pace visualizations may be the simplest, yet most useful. Check in on this as often as you can. If you notice that your team’s line, in this example, the yellow line, is going over the top of the blue line, you’re in trouble. There’s nothing worse than sitting in the top three in your league because you’ve boosted your pitching stats, going over the limit, and then watching helplessly as your team falls down the ranking ladder. On the other hand, don’t make your line so far below the “Max Pace” blue line that you are leaving points on the table.
Viz #2: Hitting Production Comparisons
Go to your league page and click on standings. Scroll down and you will find lots of helpful visualizations. In the (hard-to-see, I know) GIF below, keep an eye on the light-blue line representing my team and my per day points by offensive category.
It’s not always clear to me what I’m doing right and what I’m doing wrong in Ottoneu points leagues since I don’t have traditional roto scores to easily evaluate. Using visuals to see how you compare to top teams in your league can help. In the example above, I isolated the chart to only show my team and the two top teams in the league to see where I stand in relation. You can do this by simply clicking on the check boxes of teams you want to display below the x-axis. Then, I simply clicked through the stats I’m interested in analyzing. From this I can see that my team remains strong in walks and doubles, two big points accumulators, but that Im lacking in home runs. From here I can start thinking about ways of finding more power in hopes of balancing out some of my stats.
Viz #3: Pitching Production Comparisons
You can do the same exercise as above but with pitching statistics. Again, keep an eye on the blue line, my team. You’ll notice that compared to my competitors I am comparable in my daily saves and holds, but really lacking in strikeouts.
Now, if I couple this with the fact that my IP pace is well below where I should be by now, I can start thinking of adding more pitchers to my roster and getting more starts on the board.
Viz #4: Pitching Production Comparisons
Lastly, isolate the points per day visual down to the teams that are two places above and two places below you. This will help you identify how close you are to either advancing or being overtaken. In the visual below, my team is in yellow and I can see that I need roughly 10 more points per day to start advancing over my closest competitors. But, I can also see that I’m not separating myself from the teams that I’m beating by very much. It’s time to step on the gas!

Take the time to dig into these visualizations on your league standings page and you’ll get a much better sense of how your points are being gathered and what you need to do to move up the ranks.