K% Gains: Trend, Outlier, Or To Be Expected?
Those who have been smart enough to pick up a copy of the 2021 Baseball HQ Forecaster (and likely posted a picture of it to their Twitter) have already read through the “Other Diamonds” portion of the text. It’s my favorite part. In it, there is a section called Paradoxes and Conundrums and it states that a player’s year to year improvements can be labeled as, “a point in a growth trend, an isolated outlier or a complete anomaly…” I loved that line when I read it. But, so much strange happened in 2020 and I think it should have some say. In this post, I’ll go over three pitchers who increased their K% from 2020 to 2021 but whose gains might be skewed by the 2020 season. Two of these pitchers really just rose back up to where they were in 2019. An increase in K% is wonderful but is it a trend, an outlier, or, to incorporate my own twist, to be expected?
2021 starters league average K%: 22.6%
2021 relievers league average K%: 24%
—
Dylan Cease, K% increase: +14.6, 2020: 17.3%, 2021: 31.9% 2022 Steamer projection: 28.4%
What changed?
– 4-seamer added 2 inches of vertical movement, or 2.6 inches more rise than other similar 4-seamers. The pitch showed 10.5 inches in vertical movement in 2021, tied for 4th among all qualified pitchers (relievers and starters) in 2021.
– decreased usage of the changeup from 12.7% in 2020 to 7.4% in 2021.
– increased usage of the curveball from 9.3% in 2020 to 15.2% in 2021.
– increased K/BB (sometimes referred to as command ratio) from 1.29 in 2020 to 3.32 in 2021.
A few highlights:
– The Slider: Cease’s -8 slider run value was the best run value he has ever posted. From a wSL pitch value standpoint, the slider ranked 7th, right behind Gerrit Cole at 6th, and from a wSL/C standpoint, the pitch ranked 13th (both among qualified pitchers).
Visualization:
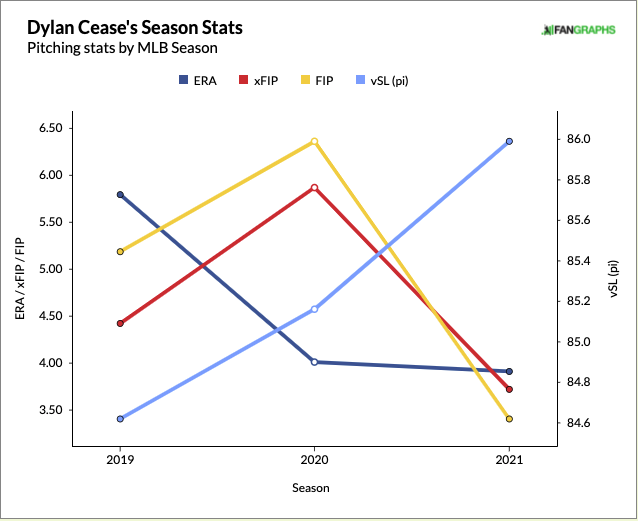
A look at this plot at the end of 2020 might have had some scared to draft Cease given that his ERA indicators finished much higher than his ERA. But the Slider’s value continued to rise and it seems pretty clear that Cease figured some things out in 2021.
Verdict: Trend but expect some regression. Steamer seems to agree, with a 28.4% predicted K% in 2022, lower than his 2021 end-of-season 31.9% but significantly higher than his 2020 17.3%.
Interested Parties Take Note: Averaging his 2019 BB% and his 2020 BB% gives you a number higher than his 2021 BB%. Could Cease have overcome his command issues noted in his “Prospects TLDR” or should we expect a higher BB% in 2022?
—
Jon Gray, K% increase: +11.8, 2020: 12.6%, 2021: 24.4%, 2022 Steamer projection: 23%
What changed?
– health, somewhat. Gray spent 27 days on the IL in 2020 with inflammation in his right shoulder which was like, half the season.
– increased usage of the slider reaching a career-high of 38.1% up from 2020’s 29.2%.
– decreased usage of both the curveball (down ~2% from 2020) and the changeup (down ~5% from 2020) and dropped the sinker completely.
– increased offspeed, breaking, and fastball velocity. Not by much, but it’s generally better than decreased offspeed, breaking, and fastball velocity.
Highlights:
– The Slider: This pitch earned a Whiff% (savant) of 38.8% in 2021 and 40.7% in 2020, so it seems like he went with a “throw your best pitch more often” approach. While the pitch does not glow savant red on his player page when it comes to vertical or horizontal movement compared to the average, it has done a great job of preventing runs, earning a run value score of -13. For comparison, that ranked 9th among qualified pitcher sliders in 2021 with Luke Jackson coming in at first with a score of -17.
Visualization:
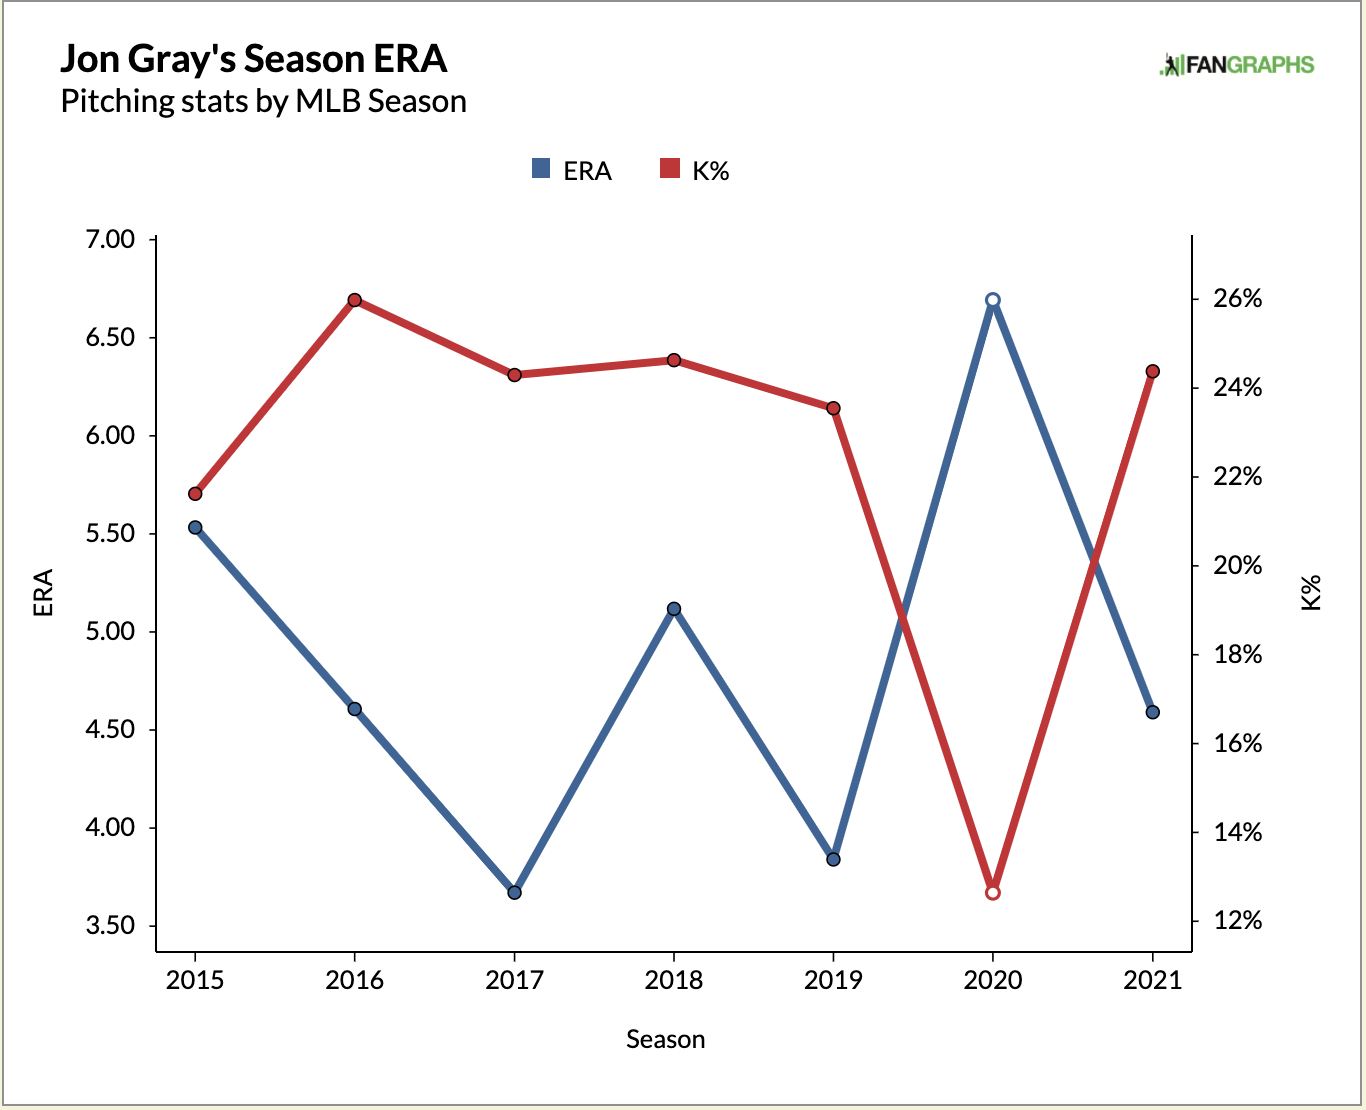
Verdict: TO BE EXPECTED! One look at the above visualization shows us how this exercise is somewhat flawed. This is not really a trend, outlier, or anomaly. It is what we should expect. 2020 was a bad year for Gray, and he rebounded in 2021. Steamer’s projection of 23% K% in 2022 is right in line with his career stats and with what he did in 2021.
Interested Parties Take Note: What we have here is a pitcher expected to post a K% higher than league average leaving Coors Field. But, he did spend 29 days on the 2021 IL due to a right (Gray is a righty) flexor strain.
—
Luke Jackson, K% increase: +11.6, 2020: 15.2%, 2021: 26.8%, 2022 Steamer projection: 25.7%
What changed?
– decreased curveball usage from 19.5% in 2020 to 11.1% in 2021.
– increased slider usage from 43.6% in 2020 to 53.3% in 2021.
Highlights:
– The Slider: (Have you noticed a trend here?) Jackson’s slider went for a whiff 42.0% of the time in 2019, 41.4% of the time in 2017 and then 35.1% of the time in 2021. So, you can surmise that he knows how to throw it. He has thrown the pitch a lot in the last three years. But, in 2021 the pitch reached a career-high (for all pitches) -17 run value, first overall (MLB) in run value for sliders. But again, it’s always been there, fetching a -14 run value in 2019.
Visualization:
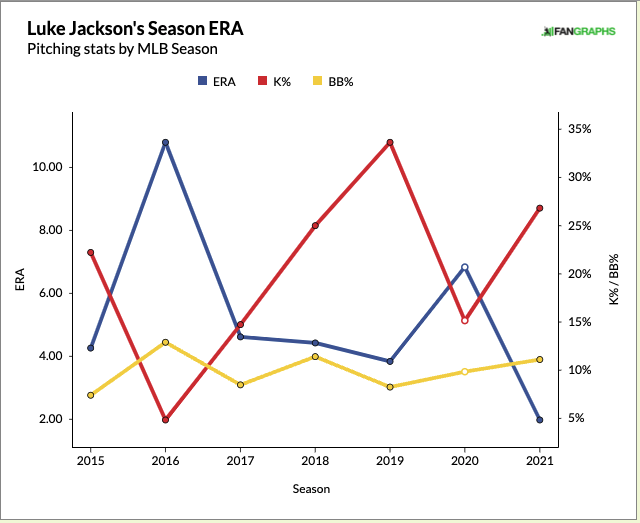
Verdict: Like Gray, this seems TO BE EXPECTED! and 2020 seems to have brought him down a peg, only to show a rebound in 2021. It’s reasonable to assume the K% reaches somewhere between 2019 and 2021. While he’s going to have trouble being fantasy relevant in 2022, fantasy managers who are in leagues that count holds should take note. He had 31 in 2021.
Interested Parties Take Note: While his K% did go up, so did his statcast Sweet Spot%, Barrel%, and Hard Hit%, Exit Velocity aaaaaaand xSLG. While most of these stats didn’t increase by a ton, there still seem to be a lot of scary categories on the rise there. It could certainly be noise, but it could also be a sign.
Consider telling us the percentiles where these pitches rank.