Jolt’s Hit Picks for May 25th, 2023
JOLT is model that I have developed to aid in the selection of players who are most likely to get a hit in order to build a hit streak while playing MLB Play’s “Beat the Streak”. The process is complicated and has gone through too many iterations to count, but it is now the closest it has ever been to an automated daily process. The model has very little to do with current player performance, though I bring that in after the model makes predictions to thin out the audience, and more to do with bat path and pitch plane. SwingGraphs supplies some great data that I’ve incorporated into my model and I’m using vertical approach angle in relation to swing and batted ball metrics to determine which hitter/pitcher matchups are best suited for the hitter and their particular swing.
Let’s make a few things clear. First, these predictions are experimental. I plan on sharing predictions once every other week here, though I may start pushing daily predictions to twitter, and I’ll keep track of how my predictions have actually played out. Second, MLB Play already has really good hit predictions, so I’ll include that model’s hit probability too, though I’m sure the models are very different. They also have an incredible dashboard that you could spend hours viewing. Third, if you play “Beat the Streak” and you get to a point where you are one pick away from winning $5.6 Million dollars, don’t rely solely on JOLT. Finally, these predictions can easily be applied to your fantasy baseball roster when considering sit/start decisions. Now, let’s take a look at five hitters JOLT predicts as most likely to get a hit:
| Batter | JOLT Hit Probability | AVG | PA | BABIP | xwOBA | Hard%+ | Pitcher | Hits Per Game | Park Factors |
|---|---|---|---|---|---|---|---|---|---|
| Ozzie Albies | 73.85% | 0.254 | 204 | 0.257 | 0.342 | 112 | Aaron Nola | 5.4 | 102 |
| Sean Murphy | 73.74% | 0.275 | 171 | 0.305 | 0.439 | 135 | Aaron Nola | 5.4 | 102 |
| Matt Olson | 73.68% | 0.234 | 221 | 0.290 | 0.362 | 124 | Aaron Nola | 5.4 | 102 |
| Riley Greene | 73.65% | 0.291 | 199 | 0.400 | 0.332 | 108 | Lucas Giolito | 5.5 | 99 |
| Spencer Torkelson | 73.64% | 0.234 | 195 | 0.276 | 0.337 | 113 | Lucas Giolito | 5.5 | 99 |
Qualified starters have given up 5.2 hits per game so far this season and Nola and Giolito are currently above that mark. In addition, one of JOLT’s most important predictors is how hard the ball is hit. JOLT is unique in that it is trained on batted ball data, but then deployed on averages. This explains why, even though Aaron Nola is a great pitcher, JOLT is predicting a few hard-hitting Braves to get a hit. Add in Truist Park’s park factors, and JOLT likes the Braves today. Let’s take a look at each prediction:
Ozzie Albies (S) vs. Aaron Nola (R) Preds – JOLT: 74% BTS: 61%
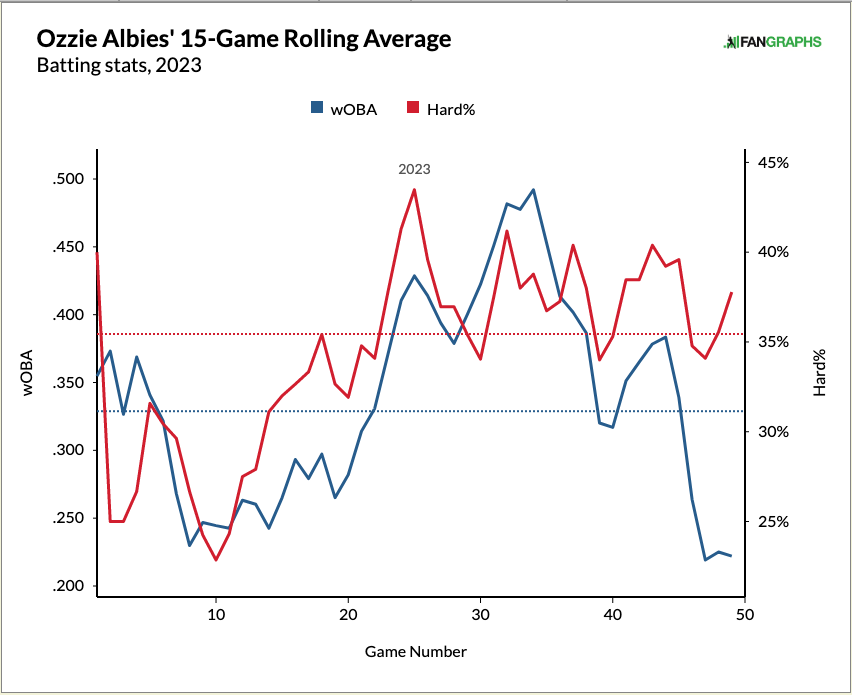
You can do a serious deep dive in the community section of the site while reading about optimal swing paths by D.K. Willardson, but vertical bat angle (VBA) is the SwingGraphs data point I’m using in JOLT. The model likes Albies average April VBA against Aaron Nola’s cutter with an average vertical approach angle of -6.39. While that is the main point of JOLT as compared to other models, finding optimal VBA vs. VAA, we could also just look at Albies’ rolling hard-hit rate to see that he’s on the up and up:
He’s a switch hitter and the angle match ups seem to be good, but if you’re suspicious of this pick, I don’t blame you. Nola’s cutter has a 2023 batting average of .267 compared to pitcher’s league average of .301. But, is there something about Ozzie’s swing that matches the cutter just right?
Sean Murphy (R) vs. Aaron Nola (R) Preds – JOLT: 74% BTS: 63%
Murphy ranks 10th among qualified hitters in hard hit rate. He’s batting .275 and while he’s pulling the ball (47.6%) more than average (40.7%), he’s also smoking the ball consistently with a statcast maxEV of 113.8. Here’s a look at Murphy’s 2023 spray chart:
Let’s see what happens if Nola throws up a sinker. JOLT likes Murphy’s chances.
Matt Olson (L) vs. Aaron Nola (R) Preds – JOLT: 74% BTS: 62%
JOLT likes Olson against Nola’s four-seamer. Here’s what happened last season when Nola put one down in the zone:
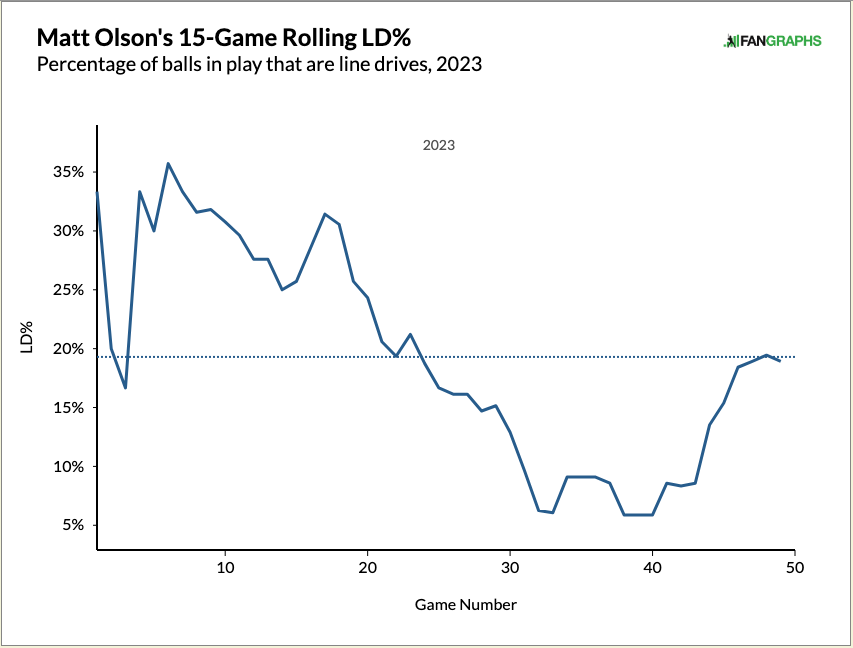
It’s happened before and it could happen again. Plus, Olson has been increasing his LD% as of late:
Riley Greene (L) vs. Lucas Giolito (R) Preds – JOLT: 74% BTS: 63%
Greene has 16 hits in his last 10 games. Giolito has been giving up .3 more hits than league average (among qualified starting pitchers), and luck has been on Greene’s side (400 BABIP). While that last one is silly to bank on, it’s mostly a reflection of the fact that Greene has been putting the ball in play and doing it with hard hit balls. Plus, the White Sox bullpen has given up the 10th most hits this season, just in case the model goes out the window and it’s left up to the unpredictable.
Spencer Torkelson (L) vs. Lucas Giolito (R) Preds – JOLT: 74% BTS: 60%
Tork has one of the lowest batting averages among players on this list and he’s only hit six in his last 25 at-bats. There’s something here in Torkelson’s swing that JOLT likes against Gioltio. He’s never had a hit against the White Sox pitcher with an amazing name, but today could be the day.


