Hot Hand or Hard Data: Is Recent Performance Weighted Enough in Pitching Projections?

When setting expectations for pitchers for a given week, it can admittedly be hard to trust the projections and ignore recent performance–whether ‘recent’ includes the last month, or the full 2025 season. Generally speaking, should you trust a typical weekly projection that accounts for the true talent level of the pitcher and the context of the matchup when setting your lineups for the upcoming week? Or is it better to focus on a pitcher’s performance from the last month or from the current season and ride the hot hand? Put differently, do typical projections place enough weight on recency?
This article sets out to answer this question.
I will use the FanGraphs monthly splits leaderboards during the Statcast era to take a fresh look at how well projections account for recency. Past studies have tended to find that hot and cold streaks have little predictive value. The impact of streakiness is a related but distinct issue from how much to weight recency, however. A typical projection uses recency weights to weigh more recent performance more heavily. How heavily recent performance should be weighed relative to performance from the more distant past is an open question.
Marcel serves as a baseline projection system that uses 3/2/1 weights for pitching performance in the previous three seasons, e.g., 2024/2023/2022 are weighted 3/2/1 for preseason 2025 projections (ignoring the regression portion and assuming equal total batters faced each season, the most recent season comprises 50% of the weight in the preseason projection). Marcel’s creator, Tom Tango, is open about the fact that these weights are a simplification that is meant to be good enough to serve as a bare minimum standard for a baseline projection system. It is well known that projections for certain statistics should place more weight on recency, like strikeout rate, whereas walk rate demands a less heavy emphasis on recency. In statistical parlance, statistics like K% “decay” more rapidly.
This past offseason, I debuted OOPSY, a novel projection system at FanGraphs. OOPSY uses recency weights that minimize forecast error when using annual historical data. For preseason 2025 projections, these weights are 3/1.2/.8 for 2024/2023/2022 for K%, 3/2.2/1.3 for 2024/2023/2022 for BB%, and 3/2.4/2.2 for 2024/2023/2022 for HR/9. I do not know the exact recency weights that other FanGraphs projection systems use but they are in all likelihood similar as our projections are all quite similar. The other systems likely generate their recency weights using a decay function.
Marcel assumes an approximate decay function of .999^(days ago), so that performance 365 days ago would be weighed 69% as heavily as performance today, and so on. I didn’t explicitly use a decay function to set the recency weights for OOPSY — I just tweaked the weights until I minimized forecast error. Compared to Marcel, my OOPSY weights place more weight on recency for K% and less weight on recency for BB% and HR/9. If I use a decay function and monthly data instead of annual data, would I find that the recency weights that minimize forecast error are similar? If not, I might want to tweak the OOPSY weights in future seasons.
To find the optimal recency weights, I ran projections for K%, BB%, and HR/9 for a sample of 31,466 player-months from 2015 to the first half of 2025. I removed hitters from the sample. All statistics were scaled to assume the same league average (2024 MLB). For each projection, I experimented with different recency weights (using different decay functions) to see how they impacted weighted root mean square error for the forecasts (weighted by total batters faced in the player-month that I was projecting).
All projection variations use the same amount of regression to the mean. For simplicity, the projections were not park adjusted. When projecting pitcher performance for the upcoming month, which set of recency weights performs best? This approach approximates weekly decision making in fantasy leagues. It’d be even better to explicitly look at how typical weekly projections have performed, but the data to do that sort of analysis is harder to come by.
For each component, I report root mean square error for six projections that each use a different recency weighting: a projection that accounts for just the most recent month of performance, a projection that accounts for the just most recent year, a projection that accounts for the last two years, a projection that accounts for the last three years, and one that accounts for the last four years. Note, I define a year as a set of six months, i.e., a season’s worth of months, not a calendar year. Aside from the Marcel models, each projection model uses the decay function that minimizes forecast error. Marcel uses a decay function of .999^(days ago).
Table 1. Root mean square error for projections of K%, BB%, and HR/9 using various recency weights.
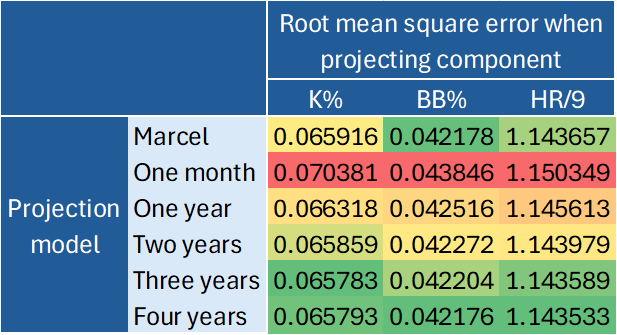
Note: a lower root mean square error represents higher accuracy.
For each of the three component statistics, K%, BB%, and HR/9, a projection model based on the most recent month of performance performs the worst of the six models tested; a forecast model based on the most recent year of performance performs second worst. Marcel’s model—using gradual recency weights covering the last three years of performance—outperforms these models.
Of the three components, K% projections weigh recency the heaviest. A K% model based on only two years of data outperforms Marcel. The best K% model captures three years of data, but with a heavy weight on recency. The optimal decay function for projecting K% is .9977^(days ago) compared to .999^(days ago) for Marcel. In practice, the optimal decay function for K% ends up placing a 62% weight on the most recent year of performance, with the other 38% of the projection weight assigned to the second and third most recent years of performance. For comparison, the Marcel-based decay function only assigns a weight of 46% to the most recent year of performance. Note, Marcel still weighs the most recent year the most heavily, of course. Adding a fourth year of historical data makes K% projections worse, even when using the optimal decay function. Based on these results, it is not necessary to go back more than three seasons when projecting K%.
For BB% and HR/9, recency is less important than it is in K% forecasts. The most accurate model for each statistic captures four years of historical data. The four-year models outperform Marcel. For BB%, the optimal forecast places a slightly larger premium on recency compared to Marcel. For HR/9, the optimal forecast places a slightly smaller premium on recency compared to Marcel. The optimal decay function for BB% is .9989^(days ago). For HR/9, it is .9995^(days ago). For HR/9, the optimal decay function assigns a 40% weight to the most recent year of performance, a slightly smaller weight than Marcel. For BB%, the optimal decay function assigns a 47% weight to the most recent year of performance, a slightly heavier weight on recency relative to Marcel.
The optimal weights outlined here can be thought of as typical recency weights for projections for these component statistics. They are similar to the recency weights OOPSY already uses, even though they are based on testing monthly data instead of annual data. For instance, OOPSY assigns a 60% weight to the most recent year of performance in its K% projections, a 48% weight to the most recent year of performance in its BB% projections, and a 39% weight to the most recent year of performance in its HR/9 projections. In comparison, the component forecasts using the optimal decay function placed the following weight on the most recent year of performance: 62% for K%, 47% for BB, and 40% for HR/9. I still may tweak OOPSY in the future to use the slightly different optimal decay functions found in this article, as they are probably the more theoretically valid and therefore safer approach.
The main takeaways from this exercise are that typical projections indeed do weigh recency enough, and that they are more accurate than a projection based on the most recent month or season or even two seasons of performance data. You can still peruse last month or current season statistics for pitchers to try to identify outliers that may be under or overrated by the projection systems. Perhaps a pitcher is hurt, or they’re rusty after time off, or their mechanics are off, or they learned a new pitch, or they got stronger, or they cleaned up their mechanics, and this shows up in their stuff or velocity metrics, and in their recent performance.
Of course, there are busts and breakouts every season, outlier cases who crush their projections, and players whose performance collapses. Last September, I found it might be worth weighing recency more heavily than usual for outliers with velocity changes. In general, though, if you like being right more often than being wrong, you should trust the popular projection systems.
Whenever you have time, it would be interesting to see some values (the one-month sample might not have enough samples) split between players on the same and different teams. Another is to limit the samples to pitchers from the same age range. to remove the post-30-year-old drop.
interesting ideas, thanks! What are your hypotheses for those subgroups? Recent performance may be more important for team changers? And for under-30s?
It’s from previous work I’ve done. New teams often change pitchers (both good and bad).
As for the age, it takes a whie to get four years of information. By that point, you’re dealing with some old, healthy guys. The results need to be on the bulk of starters, not the healthy outliers.
To be clear, you don’t need four years of data to be included in the four year projections. That version includes the full sample, whether a guy has the full 4 years of data or just 1 year of data (even if he has no data it takes the marcel approach and assumes a league average projection). & RMSE is weighted by TBF in the target month to minimize any bias toward guys with more historical data. Makes sense re: team switchers!
I would love to see those with all four years of data have all the samples run for them and see how the results line up. The four-year results right now are a mix of several different weights.