Good Stuff, Bad Results or Bad Stuff, Good Results?
When a highly touted pitcher comes into the league in this day and age, he usually has a few pitches that look like they are being enchanted by some wizard sitting in the stands. Kind of like how he-who-must-not-be-named did Harry that one time. GIFs, tweets, and threads get sent out pumping the young pitcher up. Pitch model scores, many of which are not standardized, get thrown out without explanation, and everyone pays too much in auction bids.
Stuff+ is nice because we have a dedicated glossary page to help explain it. I am curious about the pitchers who have great Stuff+ scores but do not perform. There’s a clear relationship between this year’s ERA and overall Stuff+ scores when looking at starting pitchers with at least 40 innings pitched:

In this post I will investigate the outliers; those who have bad Stuff+ scores and solid results by ERA and those with great Stuff+ scores, but poor results. We’ll start with the group showing decent results and doing it with mediocre stuff:
| Name | IP | K/9 | BB/9 | HR/9 | BABIP | LOB% | vFA (pi) | ERA | xERA |
|---|---|---|---|---|---|---|---|---|---|
| Eduardo Rodriguez | 67.2 | 8.91 | 2.13 | 0.80 | 0.253 | 83.3% | 92.5 | 2.13 | 3.05 |
| Bryce Elder | 77.0 | 7.60 | 2.57 | 0.82 | 0.290 | 83.3% | 90.9 | 2.69 | 4.01 |
| Bailey Ober | 51.2 | 8.19 | 2.26 | 0.70 | 0.246 | 77.1% | 91.7 | 2.61 | 3.53 |
| Kyle Freeland | 76.0 | 5.80 | 2.25 | 1.42 | 0.279 | 73.2% | 88.9 | 3.91 | 4.57 |
Bad Stuff, Good Results
Perhaps I could conclude the article here with a simple statement; don’t walk batters. None of the good results pitchers are walking more than 2.6 batters per nine innings and all of the bad results pitchers are walking more than 3. The question is, are these pitchers just getting lucky or are they control artists who put the ball in play and let their defense take over?
Eduardo Rodriguez: 84 Stuff+, 105 Location+, 100 Pitching+
His xERA is higher than his ERA but his Location+, which you can assume relates to walk rate, is what is fueling his success. E-Rod does have a solid slider by Stuff+ (104.0), but the rest of his pitches are below 100 Stuff+ and his fastball dips all the way down to 73.0. Remember that “Location+ only looks at actual locations and implicitly assumes the intent is generally the same across the league in certain counts with certain pitches” and Rodriguez has done a decent job of limiting walks with a 6.1% BB%.
Bryce Elder: 75 Stuff+, 100 Location+, 97 Pitching+
It’s very possible that Elder has simply been lucky in 77 innings pitched so far this season as his ERA of 2.69 is significantly different from his xERA of 4.01. His best pitch by Stuff+ is the slider and, according to Pitcher List it is below average in O-Swing%, Zone%, and CSW%. But, the other aspect of Elder’s game is a 100 Location+, and much of that score has to do with his ability to get groundballs with his sinker.
Bailey Ober: 83 Stuff+, 104 Location+, 102 Pitching+
What stands out in Ober’s stat line? A 5.6% HR/FB% and that is a volatile metric, especially in the early part of the season. His ERA (2.61)/xERA (3.53) shows he likely got lucky on a few balls that stayed in the yard, but he like Elder has decent Location+ measures and his 102 Pitching+ is the best of these four starters. As is written in the Pitching+ section of our glossary:
Pitching+ has a lower RMSE when compared to on-field results (ERA) than most projection systems. In season, Pitching+ begins to beat pre-season projections by around the 400th pitch, or four or five starts in.
Ober may not be racking up strikeouts and his above-average fly-ball rate is a little worrisome, especially as air temperatures warm up, but his Pitching+ measures give some indication that he could realistically be a 3.50 ERA pitcher the rest of the way.
Kyle Freeland: 64 Stuff+, 102 Location+, 92 Pitching+
Locating pitches with poor-performing stuff seems scary from a fantasy standpoint. But, Location+ isn’t Zone% in that it doesn’t just mean he is throwing strikes all the time. He’s placing the ball in the right location given the situation. Unfortunately, he has the highest HR/9 and the lowest K/9 in this group. His actual ERA is creeping up near 4.00 and there’s nothing in his profile that makes you think he can stay below 4.00 for much longer.
–
| Name | IP | K/9 | BB/9 | HR/9 | BABIP | LOB% | vFA (pi) | ERA | xERA |
|---|---|---|---|---|---|---|---|---|---|
| Graham Ashcraft | 65.0 | 6.92 | 4.15 | 1.25 | 0.324 | 61.2% | – | 6.78 | 5.36 |
| Jameson Taillon | 48.1 | 8.19 | 3.17 | 1.68 | 0.326 | 57.0% | 94.0 | 6.70 | 5.57 |
| Nick Pivetta | 40.0 | 9.45 | 4.28 | 2.03 | 0.309 | 66.8% | 94.2 | 6.30 | – |
| Grayson Rodriguez | 45.1 | 11.12 | 4.17 | 2.58 | 0.372 | 67.4% | 96.9 | 7.35 | 5.91 |
Good Stuff, Bad Results
Here we have talented pitchers whose stuff is off the charts but who find themselves with ERA’s above 6.00. These are the pitchers who will get you strikeouts, but will also hurt your ratios. Take a young pitcher like Grayson Rodriguez for example. His cutter has a low Stuff+ score of 76.0, but his four-seamer is well above average at 110. Just look at the slash lines (BA/SLG/wOBA) of opposing hitters on the two:
Cutter – .333/.889/.533
Four-seamer – .395/.750/.508
Opposing hitters got to the four-seamer in Rodriguez’s short stint at a near .400 average and he put the ball in the zone often:
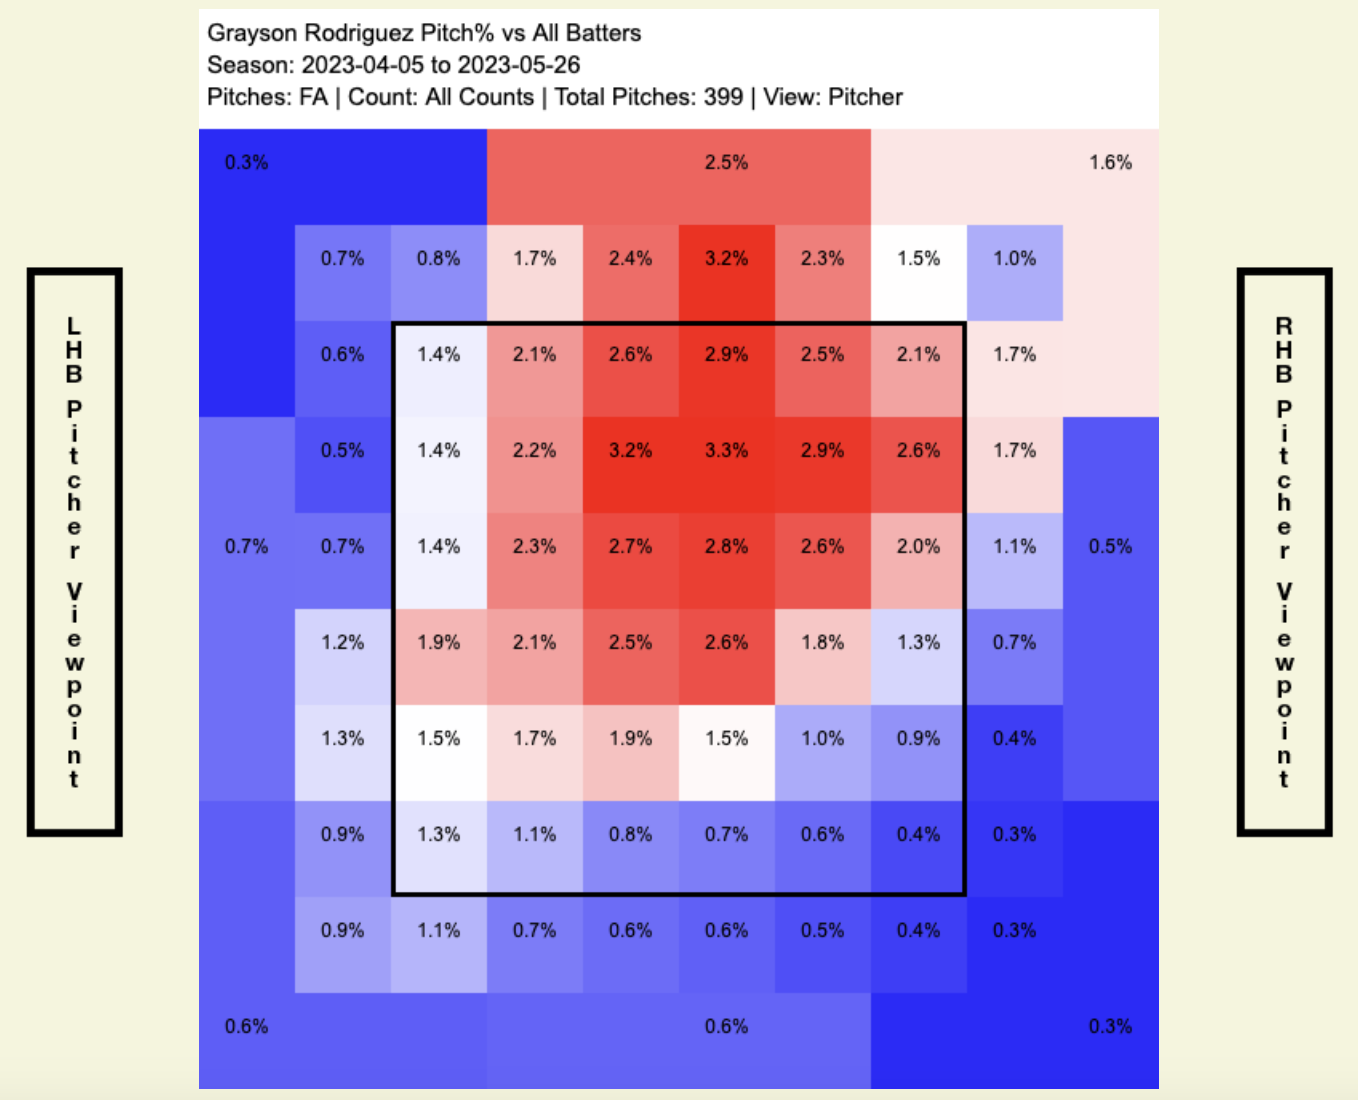
So what gives?
–
Grayson Rodriguez: 103 Stuff+, 99 Location+, 102 Pitching+
Here are some metrics from G-Rod’s last three starts in AAA:
| Date | IP | TBF | H | ER | HR | BB | SO |
|---|---|---|---|---|---|---|---|
| 2023-06-15 | 6.0 | 22 | 2 | 2 | 1 | 2 | 11 |
| 2023-06-09 | 6.0 | 26 | 7 | 3 | 1 | 1 | 10 |
| 2023-06-03 | 6.0 | 22 | 1 | 0 | 0 | 5 | 6 |
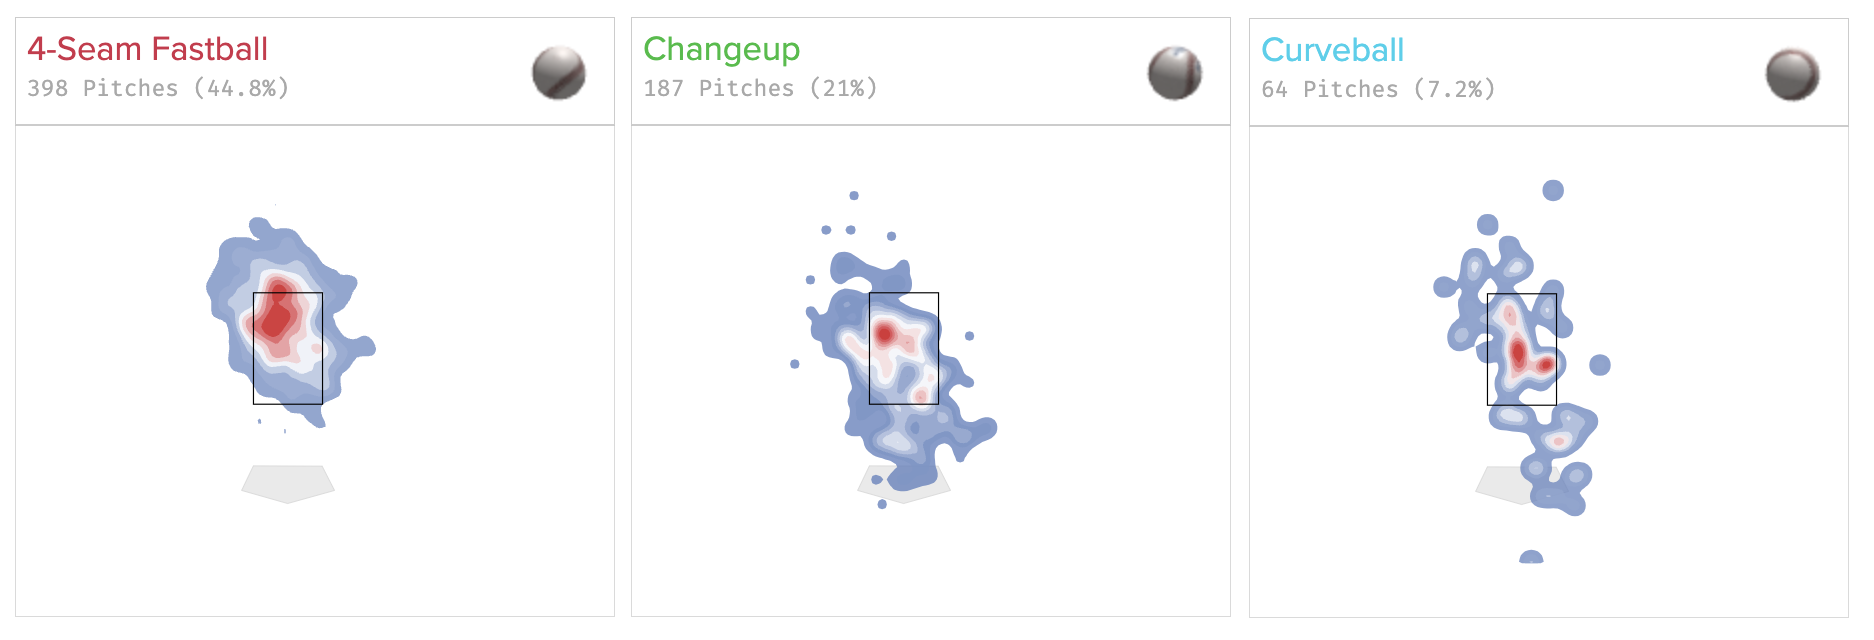
On June 3rd, he walked too many batters once again, but didn’t give up a home run and only gave up one hit. Then, in his last two starts, he gave up a home run in each game, but limited walks and increased his strikeouts. There is a pattern between when Rodriguez puts the ball in the zone and when it gets hit out of the park and in 2023, his four-seamer has left the yard six times and his cutter three times. His four-seamer may have a decent movement profile, but it’s getting hit very hard 62.7% of the time. His slider (107), curveball (119), and fastball (110) all grade out above average from a Stuff+ perspective, but he needs to command each pitch more effectively to take a step forward:
To be honest, I’m not sure why his four-seamer has such good Stuff+ metrics and gets hit so hard, but it may have something to do with that 99 Location+ measurements. It’s clear that he is putting his secondaries where he shouldn’t and perhaps that fastball needs to just come up in the zone a little further to be effective.
Graham Ashcraft: 124 Stuff+, 97 Location+, 100 Pitching+
Ashcraft’s slider Stuff+ is an insane 162 and is better than every starting pitcher with at least 60 innings pitched. Yet, Ashcraft has the third-worst ERA (6.78) in that group. Simply put, he has poor command as shown by his Location+ and Savant heatmaps:
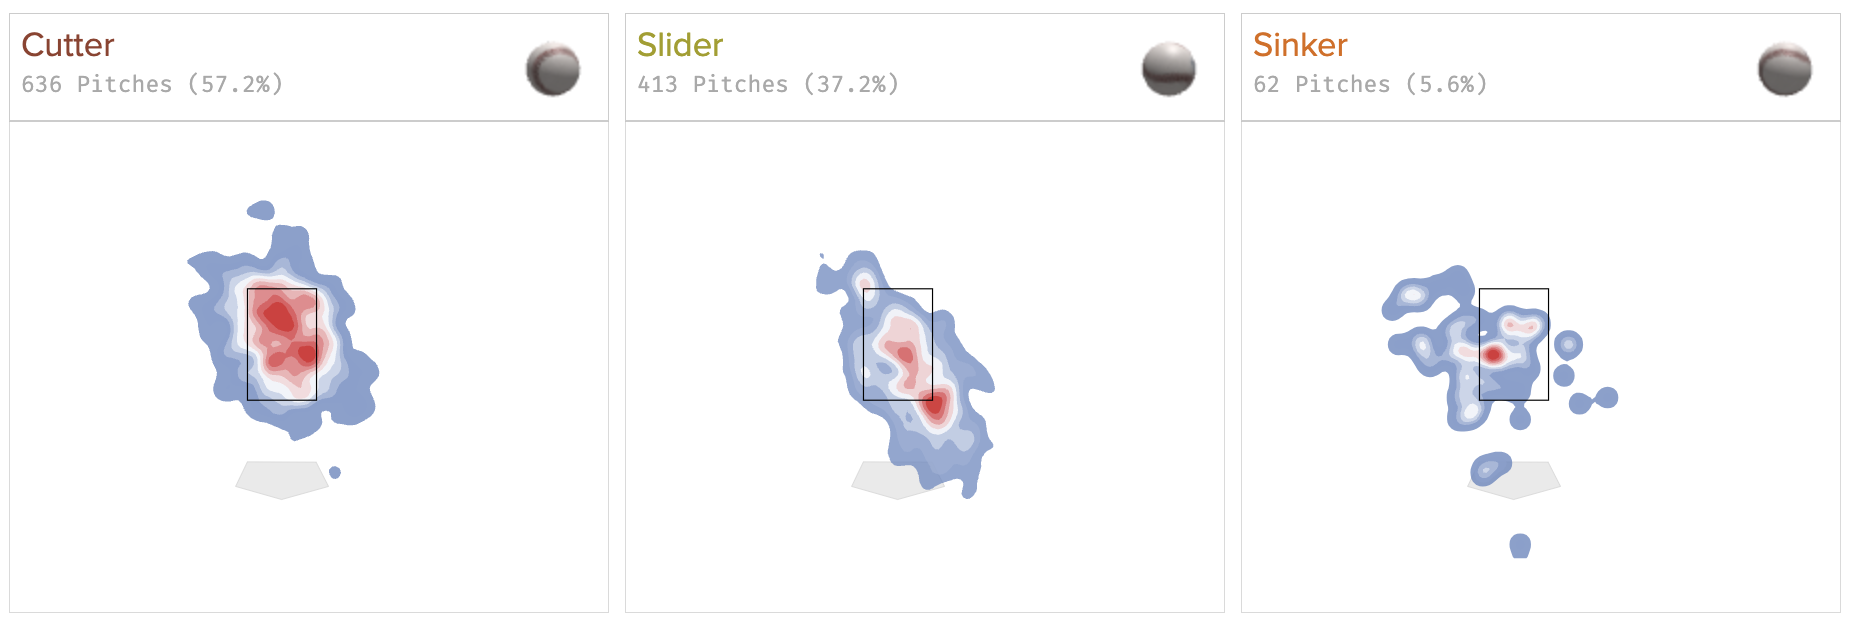
His 2023 sinker has an xSLG of .756 and though his slider is excellent from a Stuff+ standpoint, it’s given up five home runs so far this season. Match that with his high 4.15 BB/9 and you have a recipe for a high ERA.
Jameson Taillon: 101 Stuff+, 103 Location+, 102 Pitching+
I think Taillon’s curveball savant heatmap tells a story:
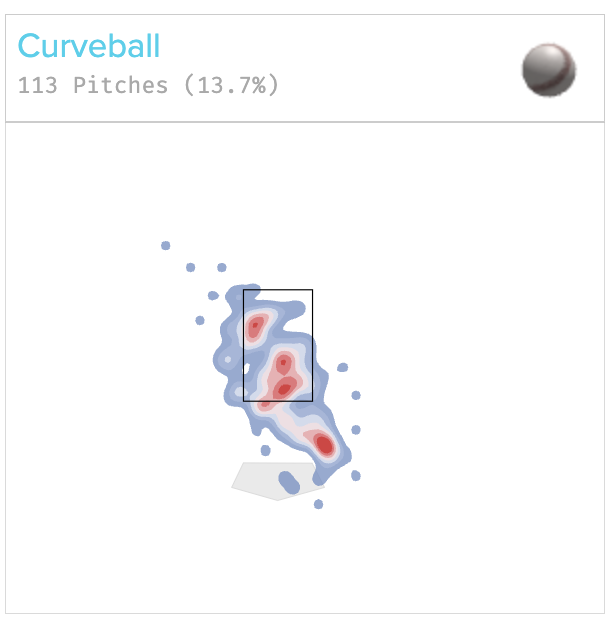
When it’s left up in the zone, it gets tacked. When he locates it down, it’s a very useful pitch. If he can bring down his 3.17 BB/9, he could start to see his ERA of 6.70 fall back in line with his xERA of 5.57.
Nick Pivetta: 110 Stuff+, 98 Location+, 101 Pitching+
With only 40 innings pitched so far this year, Pivetta has huge Stuff+ numbers on his slider, curveball, and fastball. But he has the highest BB/9 out of this sub-group. His Location+ tells us that he’s not commanding his pitches. His four-seamer is catching too much of the zone:
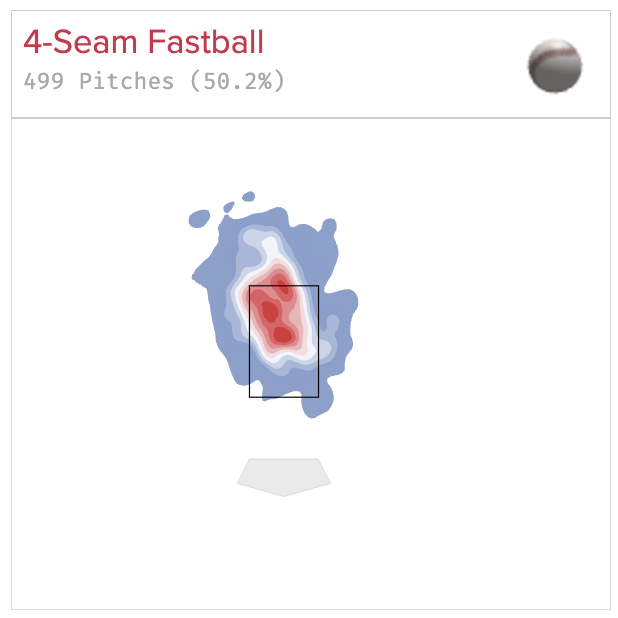
Like G-Rod, he could benefit from elevating just slightly. If he can do that and start to develop a decent-looking splitter, he could start to bring more fantasy value to the season.