Clinchers, Contenders and Innings Pitched
Do the top starting pitchers on contending teams pitch more innings as the season goes on and their team fights for a playoff spot? Do the top starting pitchers on teams that are likely to clinch a playoff spot pitch less innings as the season goes on, to save their arms for the playoffs? Unfortunately, these questions arose in my mind after I traded a big bat for a front-line starter on a team that is sure to make the playoffs right at my league’s trade deadline. Was that a mistake? Should we value hitters more than top starters on teams likely to clinch early? Is that too many questions for an opening paragraph?
The intuition behind my question is simple. A team that is likely to clinch may give their top of the rotation pitchers a bit more rest. Maybe it comes from a phantom IL stint. Maybe it’s a skipped turn in the rotation. On the other hand, teams that are trying to get that last wildcard spot should be riding their top of the rotation starters more, right? In order to look at this, I took some liberties. To distinguish between contenders and clinchers (things change quickly, what you see is where things stood on Tuesday, September 7th) I went over to our playoff odds page and went division by division. If a team had a greater than 70% chance of making the playoffs, I called them clinchers. If a team had a greater than 35% chance of making the playoffs but under 70%, I dubbed them contenders. Here’s an overview of each group:
| Clinch Teams** | Top Two Starters* |
|---|---|
| CHW | Carlos Rodón, Dylan Cease |
| TBR | Shane McClanahan, Ryan Yarbrough |
| HOU | Lance McCullers Jr., Luis Garcia |
| SFG | Kevin Gausman, Logan Webb |
| MIL | Corbin Burnes, Brandon Woodruff |
| LAD | Walker Buehler, Julio Urías |
| Contending Teams*** | Top Two Starters |
| NYY | Gerrit Cole, Jordan Montgomery |
| BOS | Nathan Eovaldi, Eduardo Rodriguez |
| PHI | Zack Wheeler, Aaron Nola |
| CIN | Wade Miley, Luis Castillo |
| SD | Joe Musgrove, Yu Darvish |
| ATL | Charlie Morton, Max Fried |
**Clinchers: >70% make the playoff FG odds
***Contenders: >35% make the playoff FG odds
Next, I went to each pitcher’s 2021 games logs and calculated the average innings pitched by day for each group. On some of these days, only one of these pitchers started. Sometimes, multiple pitchers pitched, but an average performance allowed for a clearer picture of usage over time. You’ll also see that my x-axis is labeled ‘Game Date’ but it reads more like a game number for visual purposes. Here’s what the contenders looked like from the start of the season until the time of this writing:
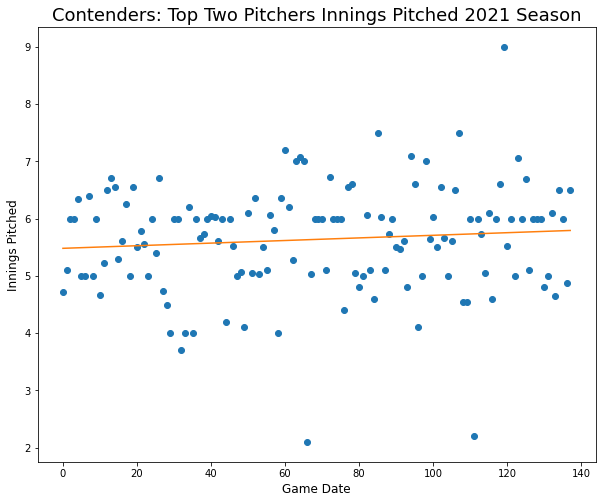
I included a line of best fit, but really we can look at the slope of the line to see what the general trend is. The slope of the contenders’ line is .002. Now, let’s look at the clinchers or those teams who may start resting their top pitchers as the playoffs approach:
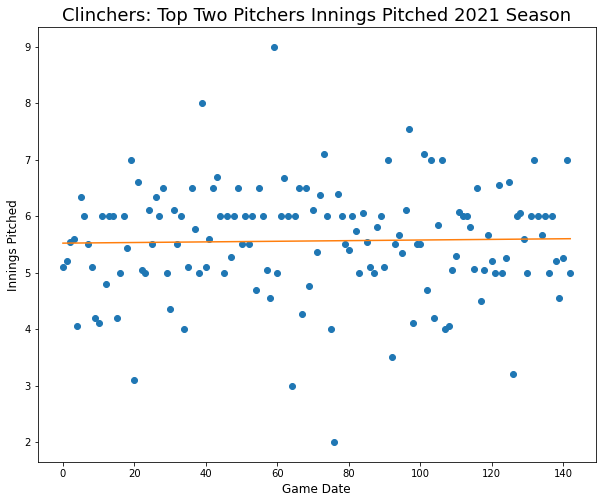
The slope of the clincher’s line is .0005. The eye test shows us that the clinchers’ line is flatter compared to the contenders. But is that significant? I don’t know, but a significance test could give some insight. In this case, I’ll limit the data to the past month because this signifies a team’s strategy change as the playoff odds change. From there, I have a very small sample size, but I’ll still run it through a two-sample t-test to see if there’s any significance between the average IPs between the two groups starting on August 8th. Drum roooollll….
Ttest_indResult(statistic=-0.7747558868190161, pvalue=0.4414767921686844)
With a p-value that high, there is really no way to determine a statistical significance. However, I think I’ve broken a few statistical rules here, one being that these samples are not at all random. I think I’ll put this on my list of off-season investigations and like always, I’ll need to add more data. In the meantime, using the line slope method does indicate that contending teams are upping their top of the rotation starters numbers on aggregate. What does this mean for fantasy managers? Well, you may be able to get a few more innings out of your starters who are contending. If you’re in a shallow league and (though not likely) one of these contender starters are available, pick them up. Lean on these contenders and don’t expect much change in the clinchers.
The White Sox are absolutely taking every opportunity to rest Lynn, Rodon, Giolito, and Cease. Skiping starts, IL stints for borderline/mild injuries/”soreness,” giving them extra days here and there. They have been doing it for a month or more. Cease is already 30 IP past his previous professional high and Rodon has his most IP since 2016.
With the position players, too. A couple of times they have even said “if it were October, he’d be out there.”