Bring It in the Zone(% ), Keep Them in the Game
So far this season the MLB average Zone% among starters is 41.6%. It’s slightly less among relievers at 40.9%, but we’re not concerning ourselves with those guys in this study. I recently heard a broadcaster say something along the lines of, “He’s throwing strikes, he’s keeping them in the game”. It’s not a direct quote and I don’t even remember who said it, but I do remember that the statement made me think. Does throwing the ball consistently in the zone make a starter more likely to record the win?
First, if you’re throwing the ball in the zone as a starting pitcher, you are likely walking less batters and that’s usually a good thing for your team’s chances of winning. For the most part, throwing more strikes has an inverse relationship with walks:

In addition to allowing less walks, throwing the ball in the zone at high rates correlates with a starter’s IP/G, which is crucial in order to qualify for the win at the end of the game.
Here’s a sortable table showing the correlations among qualified starting pitchers between Zone% and a few hand selected metrics:
| Zone% | |
|---|---|
| W | 0.37 |
| F-Strike% | 0.35 |
| Swing% | 0.33 |
| IP/G | 0.31 |
| TBF/G | 0.28 |
| CStr% | 0.21 |
| Contact% | 0.15 |
| CSW% | 0.10 |
| L | 0.10 |
| K% | 0.00 |
| ERA | -0.02 |
| SwStr% | -0.05 |
| WHIP | -0.19 |
| BB% | -0.25 |
Wins recorded in a single season correlates the most with Zone% in the table above. Maybe I’m biasing this investigation by hand selecting variables, but I promise I just chose a bunch that I was curious about. So far, the answer to our question seems to be yes. Throwing strikes does keep your team in the game. But what about the damage hitters can do when they are thrown strikes? ERA shows a slight but right correlation with Zone%.
Let’s bring in a few more years of data:
| Zone% 2021 | Zone% 2022 | Zone% 2023 | |
|---|---|---|---|
| W | 0.21 | 0.37 | 0.07 |
| F-Strike% | 0.43 | 0.35 | 0.38 |
| Swing% | 0.59 | 0.33 | 0.53 |
| IP/G | 0.22 | 0.31 | 0.19 |
| TBF/G | -0.01 | 0.28 | 0.09 |
| CStr% | 0.03 | 0.21 | 0.09 |
| Contact% | -0.08 | 0.15 | 0.23 |
| CSW% | 0.27 | 0.10 | 0.01 |
| L | -0.02 | 0.10 | -0.00 |
| K% | 0.34 | 0.00 | -0.02 |
| ERA | -0.30 | -0.02 | 0.07 |
| SwStr% | 0.25 | -0.05 | -0.05 |
| WHIP | -0.48 | -0.19 | -0.23 |
| BB% | -0.44 | -0.25 | -0.47 |
It’s not a steady, sure-fire thing, is it? There’s also the problem of having small amounts of data to work with because only so many pitchers make it to qualification at the end of the year. Wins didn’t have as much of a strong correlation with Zone% in 2021 as it did in 2022, and so far in 2023, the relationship is even weaker. We are only in the second full month of the season, so the 2023 sample is even smaller. So far, there are only 65 qualified starters. Which of the top 10 qualified starters in 2023 by Zone% are also in the top 10 by wins?
| Name | Team | Zone% | W | Rank |
|---|---|---|---|---|
| George Kirby | SEA | 49.0% | 6 | T-5 |
| Mitch Keller | PIT | 47.3% | 8 | T-3 |
| Michael Lorenzen | DET | 46.8% | 2 | T-9 |
| Shane McClanahan | TBR | 46.6% | 11 | 1 |
| Logan Gilbert | SEA | 46.2% | 4 | T-7 |
| Chris Bassitt | TOR | 46.0% | 7 | T-4 |
| Shohei Ohtani | LAA | 45.8% | 6 | T-5 |
| Justin Steele | CHC | 45.7% | 7 | T-4 |
| Miles Mikolas | STL | 45.5% | 4 | T-7 |
| Ryne Nelson | ARI | 45.5% | 3 | T-8 |
There are a few but it’s hard to rank wins this early in the season given how many pitchers are tied with eight wins, seven wins, and so on. The same issue presents itself when we add more data and visualize the relationship between Zone% and W across multiple seasons:

This basically tells us that any end of season Zone% can generate any number of wins. That is a key aspect, the end of season data. I’m muddying up the waters here by bringing in early season numbers and comparing them with end of season numbers. It’s not an apples to apples comparison. The better way to look at this might be to pull out game-by-game Zone% and wins, which I won’t be doing here.
Furthermore I would like to see a split of Zone% by month among qualified starters, but our splits leaderboard doesn’t show plate-discipline in that way. It would help to see how much a starter’s Zone% changes from month to month. Instead, how about we take a two examples and compare? Here is notorious strike thrower Rich Hill’s Zone% by season compared to the MLB average in each season and with wins brought in on top:
It’s best to look at 2016 and beyond as those were the years Hill accumulated starter level innings. Yes, in the 2016, 2017, and 2018 seasons, he was putting the ball in the zone way more often than the average starter and he was accumulating 10+ wins. But he was also on the Dodgers. Ready for example two? See below a current day starter with a below-average career Zone% of 37.9%, Corbin Burnes:
Nothing. Makes. Sense. As soon as Burnes started throwing his cutter/changeup while dropping his split-finger fastball in 2020, he didn’t need to put it in the zone in order to win the game.
So where does all of this leave us? Probably back to the idea that awarding starting pitchers a win at the end of the game has as much to do with the pitcher as it does with all kinds of other elements. But, if we stop looking at this from a player standpoint and generalize it to a team, we notice the trend is slightly stronger:
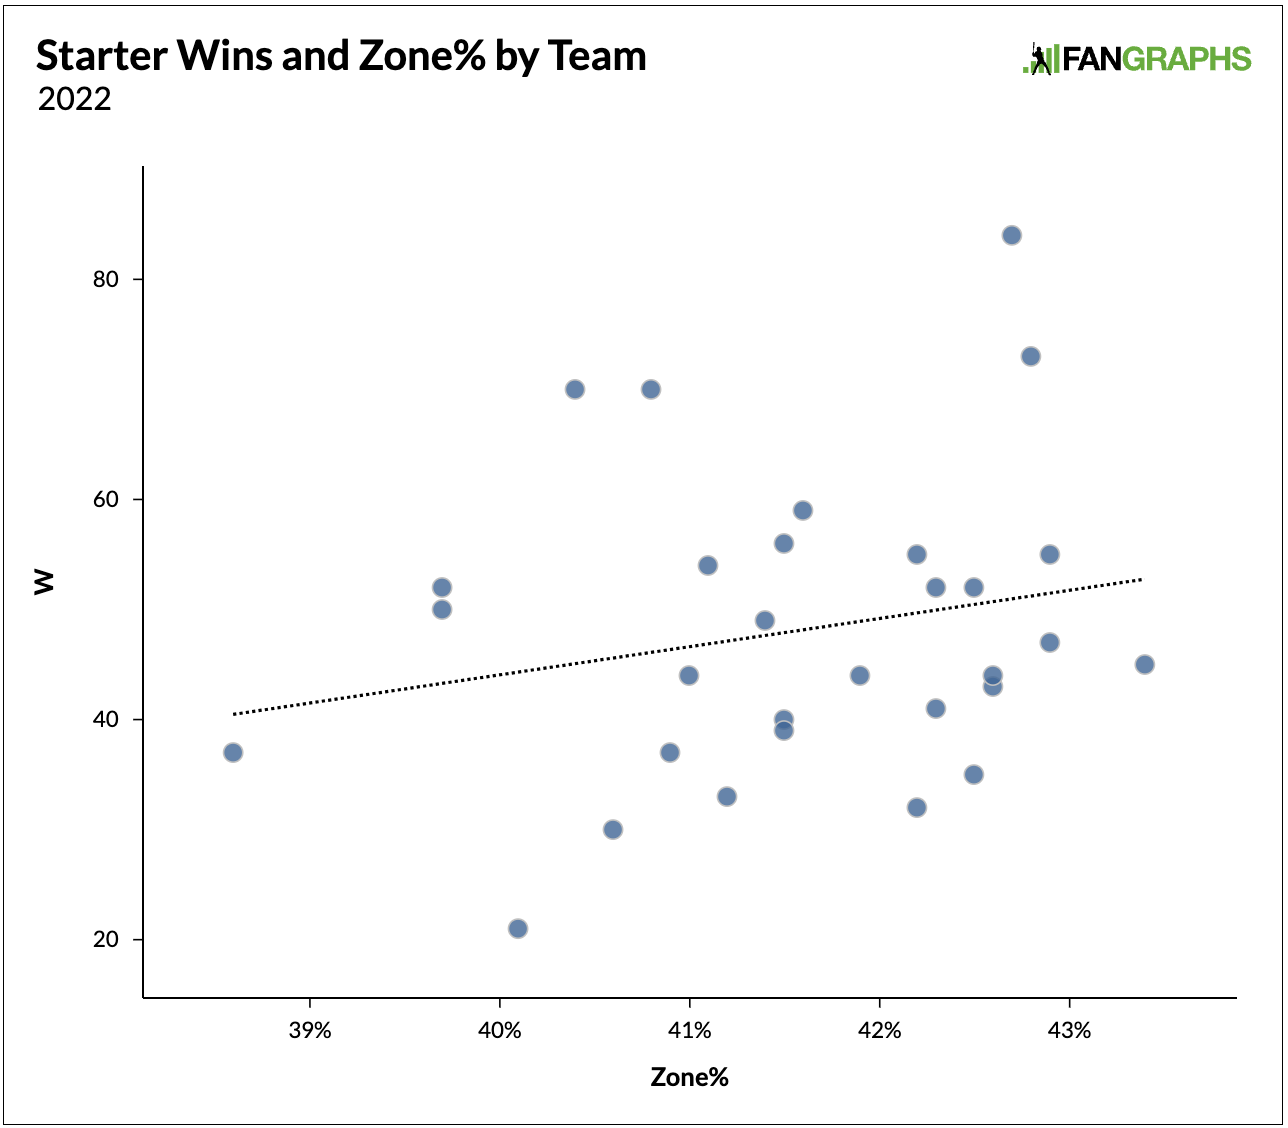
Do strike throwers keep their team in the game? I can confidently answer that question with a yes. But keeping your team in the game is different from being awarded the win. If you want to keep going down this rabbit hole, below is each team’s top strike thrower along with the team’s wRC+, Off, Def, and Bullpen (Reliever) ERA. If you stare long enough and sort a certain number of times, your fantasy team may get a sudden boost in win accumulation:
| Team | Highest Zone% SP | Zone% | Def | Off | Bullpen ERA |
|---|---|---|---|---|---|
| ARI | Ryne Nelson | 45.5% | -3.7 | 31.7 | 4.16 |
| ATL | Spencer Strider | 45.4% | -6.7 | 60.9 | 3.58 |
| BAL | Dean Kremer | 43.1% | -19.6 | 27.9 | 3.62 |
| CHC | Justin Steele | 45.7% | -4.8 | 2.0 | 4.33 |
| CHW | Lucas Giolito | 41.4% | -18.3 | -43.1 | 4.74 |
| CLE | Shane Bieber | 41.6% | -6.8 | -39.7 | 2.98 |
| COL | Kyle Freeland | 43.2% | -16.9 | -74.0 | 4.5 |
| DET | Michael Lorenzen | 46.8% | -5.5 | -47.5 | 3.79 |
| HOU | Hunter Brown | 45.0% | -5.9 | -9.0 | 3.53 |
| KCR | Zack Greinke | 42.6% | -4.9 | -53.8 | 4.84 |
| LAA | Shohei Ohtani | 45.8% | -9.8 | 28.2 | 3.56 |
| LAD | Clayton Kershaw | 43.3% | -9.4 | 43.0 | 5.01 |
| MIA | Sandy Alcantara | 45.3% | -14.6 | -15.4 | 3.94 |
| MIL | Freddy Peralta | 42.4% | 14.7 | -50.3 | 4.05 |
| MIN | Joe Ryan | 45.4% | -16.6 | -2.9 | 3.76 |
| NYY | Gerrit Cole | 41.6% | -2.5 | -16.3 | 2.94 |
| OAK | JP Sears | 43.9% | -20.3 | -38.8 | 5.51 |
| PHI | Aaron Nola | 43.6% | -18.4 | -1.0 | 4.33 |
| PIT | Mitch Keller | 47.3% | -3.4 | -13.7 | 4.41 |
| SDP | Yu Darvish | 44.6% | -3.2 | 3.9 | 3.37 |
| SEA | George Kirby | 49.0% | -2.3 | -13.8 | 3.53 |
| SFG | Anthony DeSclafani | 42.3% | 3.8 | 27.2 | 3.7 |
| STL | Miles Mikolas | 45.5% | -17.3 | 23.8 | 4.15 |
| TBR | Shane McClanahan | 46.6% | -9.5 | 98.8 | 3.94 |
| TEX | Jon Gray | 44.1% | 13.7 | 64.9 | 4.38 |
| TOR | Chris Bassitt | 46.0% | -4.3 | 27.3 | 3.99 |
| WSN | Patrick Corbin | 43.8% | -25.2 | -23.7 | 4.87 |