Author Archive

Cameron Rupp Has Been Red Hot

Cameron Rupp has been surging for the past month and a half, producing a .298/.353/.575 slash line over that period. Pretty solid numbers in their own right, and he has been one of the most valuable offensive forces in baseball over this stretch (ranked 29th by wOBA). It is even better when you consider he is a catcher with a 7% owned rate in the Yahoo leagues.

Following the conclusion of the 2015 season, during the end of season meetings, Pete Mackanin suggested Rupp may benefit from altering his bat path. During the off season, Cameron with the aid Chris Edelstein, a batting instructor he has known since childhood, went to work on shortening his bat path and focusing on the top of the ball. He came into spring training this season with a newly adapted swing, one in which he describes as having “a minor adjustment.” In early May, Rupp told Joe Harris, a contributor of MLB.com:
Read the rest of this entry »


Statcast FIP: Estimate The Home Runs

There are numerous ways to use Statcast data to estimate FIP, many involving various methods for estimating HR/FB ratios using average fly ball distances or launch angles. I address the issue using a more granular approach, evaluating each batted ball on a case by case basis.  I am calculating the probability of the batted ball going over the fence by comparing it to all similarly hit balls dating back to the beginning of the 2015 season. Next, I sum all of these probabilities, and call it the estimated number of home runs. In theory, this number should be park and environment (temperature, altitude, weather) neutral, similar to xFIP in some ways.  I call this scFIP.

The following table shows the top 10 pitchers by scFIP. These pitchers have a minimum of 40 IP.


A look into the new Marlins Park dimensions.

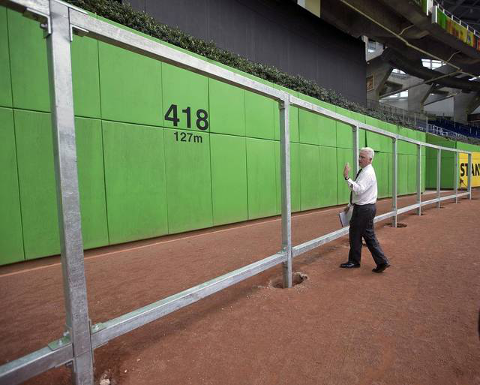
We are two fifths of the way through the season, and the Marlins have played 30 home games in their newly modified home ballpark. They had two goals this winter when they decided to modify their park; more home runs, and giving outfielders the opportunity to make exciting, home run robbing catches, which was nearly impossible given the original dimensions and near ubiquitous 11.5 foot high walls. The Marlins moved the center field fence in about 3-20 feet, reducing the deepest area of the ballpark from 418 feet to 407, whilst simultaneously dropping the height of the wall from 11.5 to 8.5 feet. This change takes part over a large curved section of the outfield wall, as you can see in the two images below.

marlins1

Claude Delorme standing in front of the new wall during a media event announcing the park changes that took place in February. Delorme is standing, approximately, where the 407 foot marker now stands in Marlins Park.  Image Source: MLB

marlins6

My sketch of the change to center field.

This is a rough estimate I created using the best information available to me. You can see the original fence in blue, and the new fence in black. The fences diverge around the 392 marker in right center field, wrap around center field, and connect again on the plinth of the home run sculpture. By my estimate, the new fence is roughly 20 feet shorter at the plinth, although there is a lot of odd curvature going on so the exact number may not be important.

Read the rest of this entry »


Fitting Running Speed into xOBA and xBABIP.

To date, my various xStats have made no attempt to account for batter speed, and the omission has amounted to one of the most glaring weaknesses of the stats. That changes today. As of this morning, I have implemented a method for estimating batter speed. This is my first real crack at the problem, it is most assuredly a work in progress, but it seems to be offering up better results. Allow me to explain.

How I am estimating speed. Since I don’t have access to clocked running times, and my database doesn’t even have base runner data such as stolen bases, I have to be creative in how I estimate speed. Earlier this week I had a Eureka moment, if you could call it that, regarding infield ground balls. I have noticed that a lot of players who have wildly differing BABIP and xBABIP scores also tended to have  more ground balls, along with above average foot speed. So, I have decided to use this observation in my favor. It isn’t perfect, slow batters do get infield hits from time to time, but they are uncommon and often reliant on misplays, luck, or both. Fast runners, though, they do seem to have the ability to get on base more consistently on infield hits.

I am defining an infield hit as one in which the ball travels no further than 90 feet. Getting some of the math out of the way, I am creating a simple ratio; the actual number of infield singles divided by the expected number of infield singles based upon launch angle and velocity. I am calculating this ratio both for the players and for the whole league. I then divide the player’s ratio by that of the league to generate the player’s ‘speed’. As you might expect, faster runners, like Ben Revere and Billy Burns sit atop this leader board, while slower runners like Jarrod Saltalamacchia and David Ross are towards the bottom.

Read the rest of this entry »


Five batters who are outperforming their xOBA.

Last week I wrote about eight players who are under performing their xOBA, so it seems only natural to talk about a few over performers today. There are a bunch of great cases to draw from, including Odubel Herrera and Xander Bogaerts, and below you will find a table that the players with the 15 largest differences between their wOBA and xOBA. Whereas many of the under performers last week were generally slow runners, many of the over performers are fleet of foot.  I have tried to single out the guys who are closer to average runners to talk about today.

Fifteen Batters Out Performing their xOBA
name team G PA AB xAVG ΔAVG xOBP ΔOBP xSLG ΔSLG xBABIP ΔBABIP xOBA ΔOBA
Odubel Herrera PHI 52 225 188 .251 .068 .367 .060 .315 .132 .314 .071 .321 .061
Josh Harrison PIT 48 187 174 .256 .072 .295 .065 .357 .074 .293 .074 .283 .060
Jacoby Ellsbury NYY 43 182 164 .234 .047 .302 .042 .315 .100 .280 .048 .272 .060
Jackie Bradley BOS 50 203 178 .288 .044 .371 .038 .472 .129 .314 .059 .366 .057
Jonathan Villar MIL 51 223 185 .241 .062 .354 .055 .325 .091 .324 .091 .313 .052
Daniel Murphy WSH 52 213 198 .340 .054 .380 .047 .578 .058 .344 .067 .397 .051
Travis Shaw BOS 53 220 200 .254 .041 .323 .036 .437 .073 .317 .063 .325 .047
Marcell Ozuna MIA 52 215 198 .279 .049 .338 .043 .518 .053 .305 .080 .358 .046
Dexter Fowler CHC 49 223 182 .269 .044 .395 .040 .395 .133 .336 .053 .370 .046
Eduardo Nunez MIN 41 175 164 .279 .050 .311 .045 .457 .037 .313 .061 .318 .046
Xander Bogaerts BOS 52 242 222 .304 .043 .359 .038 .452 .057 .352 .047 .346 .045
Jay Bruce CIN 48 193 177 .241 .030 .293 .028 .440 .119 .284 .010 .323 .045
Eric Hosmer KC 52 217 201 .284 .039 .334 .035 .493 .049 .314 .053 .346 .043
Steven Souza TB 47 191 175 .227 .036 .293 .032 .401 .056 .322 .056 .297 .042
Billy Burns OAK 47 200 188 .227 .034 .271 .031 .275 .055 .263 .030 .238 .039
Δ = Difference, Stat – xStat.
Higher differences indicate a player has over performed their expected stat.

Read the rest of this entry »


Eight Players Under Performing their xOBA

I’ve been developing expected stats that attempt to objectively measure the true batting skill for individual players, and I’ve done my best to describe them over the past few weeks. Today is more about application. I’ve taken all players with 100+ plate appearances and sorted them based upon their difference between wOBA and xOBA. Here are eight of the biggest xOBA under performers for the season to date:

Differences between Expected and Actual Stats
name team G PA AB xAVG ΔAVG xOBP ΔOBP xSLG ΔSLG xBABIP ΔBABIP xOBA ΔOBA
Kendrys Morales KC 45 182 166 .258 -.071 .314 -.067 .509 -.196 .260 -.052 .347 -.098
Trevor Plouffe MIN 29 120 115 .281 -.029 .306 -.031 0.487 -.104 .313 -.030 .326 -.042
Brian Dozier MIN 41 175 155 .237 -.037 .320 -.033 0.413 -.077 .255 -.038 .321 -.044
Cameron Rupp PHI 27 106 103 .327 -.045 .350 -.048 .624 -.187 .390 -.020 .395 -.076
Howie Kendrick LAD 39 137 128 .297 -.070 .339 -.069 .424 -.135 .356 -.087 .325 -.076
Adam Jones BAL 38 166 154 .280 -.053 .333 -.050 .516 -.152 .302 -.046 .358 -.073
Nick Markakis ATL 44 199 167 .284 -.050 .388 -.041 .400 -.077 .330 -.053 .358 -.054
Prince Fielder TEX 46 192 170 .249 -.055 .320 -.049 .363 -.081 .297 -.067 .302 -.054
Δ = Difference, Stat – xStat.
Lower differences indicate a player has under performed their expected stat.

Alrighty, let me explain this chart a little. The xAVG, xOBP, xSLG, xBABIP, and xOBA are all stats I calculate based upon the velocity and launch angle of the batted balls. The Δ columns are the differences between the measured stat and the expected stat, for example AVG – xAVG = ΔAVG. The lower the number, the more the player has under performed their expected values.

Read the rest of this entry »


What exactly do launch angles mean, anyway?

Given how new Statcast is, I’m sure just about everyone has wondered what exactly launch angles mean. During games you see numbers flying through the game feed. So and so hit the ball 98mph at 27 degrees! Someone else hit it 101 mph at 37 degrees, or 5, or 17! Woo hoo! But what does this stuff mean? It’s hard enough to visualize what a 17 degree angle might look like, let alone what it means during a baseball game.  You may have heard something along the lines of “a launch angle in the high 20’s, 27-29 degrees, will maximize distance,” and that means more homers, right? So maybe hitting the ball on that angle, as hard as you can, is the best way to provide as much offense as possible.  However, only thinking about maximizing distance makes me a little uncomfortable. It feels, dare I say, a little old school. We live in a new era with new data to play with, and, hey look, I’ve made some charts!

Read the rest of this entry »


A New BABIP for a Statcast Era

Last week I wrote about my efforts to build batted ball stats exclusively using data from Statcast. I described my method for classifying launch angles into larger launch windows, and then separating these windows into a series of buckets based upon their launch velocity. Whereas others have used combinations of line drive, opposite field and hard hit rates to construct approximations for launch angles, I am, for better or worse, exclusively using the launch angles and speed, discarding every other facet of the game in the process.

Many have worked towards teasing apart the luck and skill aspects for balls in play. Up until the last calendar year, perhaps the best methods available involved incorporating line drive and opposite field hit rates. Line drives due to their significantly higher likelihood of being a base hit, and the opposite field hits because they are more likely to be line drives. However, there is a lot of information lost to this sort of categorization. For instance, where was the ball hit, how hard? Using Statcast data, we can build a more granular view of batted balls, and define new types of batted balls, along with their observed characteristics. Now that we are in the Statcast era, the line drive, fly ball, ground ball, and pop up categorical system may become obsolete.

Read the rest of this entry »


xOBA and Using Statcast Data To Measure Offense

For many years, I couldn’t wait to get my hands on batted ball velocity and launch angle data. When Statcast data became public last year, I wasted no time jumping in and playing around with the data. Last season, I began to develop a series of stats using information from Statcast, the fruits of which are what I call xOBA and xBABIP, with various spin off stats such as xRA (expected runs average for pitchers).

Over time, I hope to delve deeper into these stats, how I think they may be useful, and some interesting results I have found, but before all of that, I bet you’re curious how they are calculated.

Read the rest of this entry »