Much like Hot Right Now, Cold Right Now will be a weekly Ottoneu feature with a focus on players who are being dropped or who maybe should be dropped in Ottoneu leagues. Hot Right Now will focus on players up for auction, players recently added, and players generally performing well. Cold Right Now will have parallel two of those three sections:
- Injuries: Players who are being cut because of IL stints.
- Roster Cuts: Analysis of players with high cut% changes.
- Cold Performers: Players with a low P/G or P/IP in recent weeks.
There won’t be a corresponding section to Current Auctions because, well, there is nothing in cuts that correspond to current auctions.
Roster Cuts
Yasmani Grandal, Add% (-) Change (7 days) – 7.06%
Grandal has just never gotten back to the 2021 season that made him so valuable to roster. In 2021, he walked 23.2% of the time while striking out only 21.9% of the time. He hit 20+ home runs in 5 consecutive seasons if you don’t count the 2020 season, hitting 23 in 2o21. Then in 2022, he hit only five home runs and right now, he has six. It might appear that Grandal’s power has been rebounding some, but it’s still a long way away from his 2021 and even 2019 marks and his current hard-hit rate of 33.5% is a career low. The 34-year-old catcher is at 3.33 points per game in Ottoneu points leagues and is being cut because of it.

Luis Matos, Add% (-) Change (7 days) – 6.09%
Matos is 21 years old, has only 86 MLB plate appearances, and has a .263 batting average. He is the Giants’ 2023 number-one prospect. But, he’s only slugging .342, and perhaps people were expecting him to immediately be like he was (.398/.435/.685) in 116 AAA plate appearances before being called up to the bigs? Here’s a snippet from his prospect write-up by Eric Longenhagen and Tess Taruskin:
He’s still chase-prone, but his high-end exit velos are up compared to 2022, and the beautiful, 180-degree finish Matos’ swing would show at peak has returned with greater frequency. Wielding one of the prettier righty swings in baseball, Matos is moving the barrel all over the zone and turning on up-and-in pitches with power again.
If he was dropped in your league, he should probably be picked up. Small of a sample as it is, he is striking out 12.1% of the time which is the third lowest among Rookies with at least 50 plate appearances in 2023 behind Alec Burleson at 10.7% and Masataka Yoshida at 10.9%. Matos has a bright future and should be held onto in Ottoneu leagues for the long run.
Nick Pratto, Add% (-) Change (7 days) – 6.09%
Pratto’s player page Prospect TLDR reads, “A swing and approach change unlocked huge in-game power for Pratto, who also has a good idea of the zone…”, but his power has been disappointing in 2023. He is only slugging .389 (below the .411 MLB average) with six home runs. Pratto’s biggest knock so far is his 37.5% strikeout rate but even in AAA during 374 2022 at-bats, Pratto struck out 30.5% of the time. He hits the ball hard 45.3% of the time according to Statcast and that is greater than the 39.5% league average mark. His 9.5% Barrel% is also above the league average but only by a hair. No, the issue here seems to be that Pratto is pressing, trying to get back to the hot streak he went on in early June. Match that with the fact that he’s been benched for Matt Duffy as written by Jeff Zimmerman in a recent lineup analysis, and Pratto may just need to re-focus his swing approach.

If it were me, I wouldn’t be dropping a 24-year-old first-round pick like Pratto in any Ottoneu format. I would remain patient.
DL Hall, Add% (-) Change (7 days) –5.13%
A back injury over the winter has kept Hall down and it was recently reported that he has “…been at the Orioles’ spring training facility in Florida for the past four weeks”. Prior to that, he made 11 starts at AAA posting a 4.57 ERA with an 11.32 K/9, but a 5.66 BB/9. That’s Hall’s biggest challenge; control. His stuff is unreal but it comes with very shaky command. In his one major league relief appearance in 2023, he struck out seven in three innings, but he walked one and gave up a home run getting tagged with two earned runs. It is also apparent that Hall is destined for a relief role if and when he gets healthy this summer. His velocity needs to get back up to his 2022 mark (96.4 MPH vFA) and he needs to dial in his control issues if he wants to get back to the bigs. The O’s could certainly use another reliever who can appear between the starters and the All-Star back end of the bullpen.
Anthony Desclafani, Add% (-) Change (7 days) – 5.13%
Desclafani is working his way back from a shoulder injury and perhaps some fantasy managers saw his rehab appearance stats and decided they were out. The 33-year-old righty threw four innings at the rookie-level Arizona Complex League and gave up a home run. He did record four strikeouts and did not give up a walk. He last appeared for the Giants on July 1st so it hasn’t been a long IL stint and he is lined up to start on Tuesday, July 18th. His 2023 ERA (4.44) is slightly different from his xERA (4.92), but he is walking fewer batters than his projections expected and he’s giving up fewer home runs than expected too. He’s begun using his slider and changeup more often while dropping his fastball and curveball usage and that’s good because the slider/changeup are his best pitches. I would keep an eye on Desclafani over his next few starts, perhaps benching him for his first start back from IL to see how he’s looking. He’s lined up to face the Reds.
Cold Performers
To measure cold performers this week, I’m looking for players with low P/G or P/IP in the last 30 days.
Tim Anderson, 0.65 P/G:
TA hit over .300 in his last four seasons (2019-2022) but he currently sits at .227. His power has been sapped:
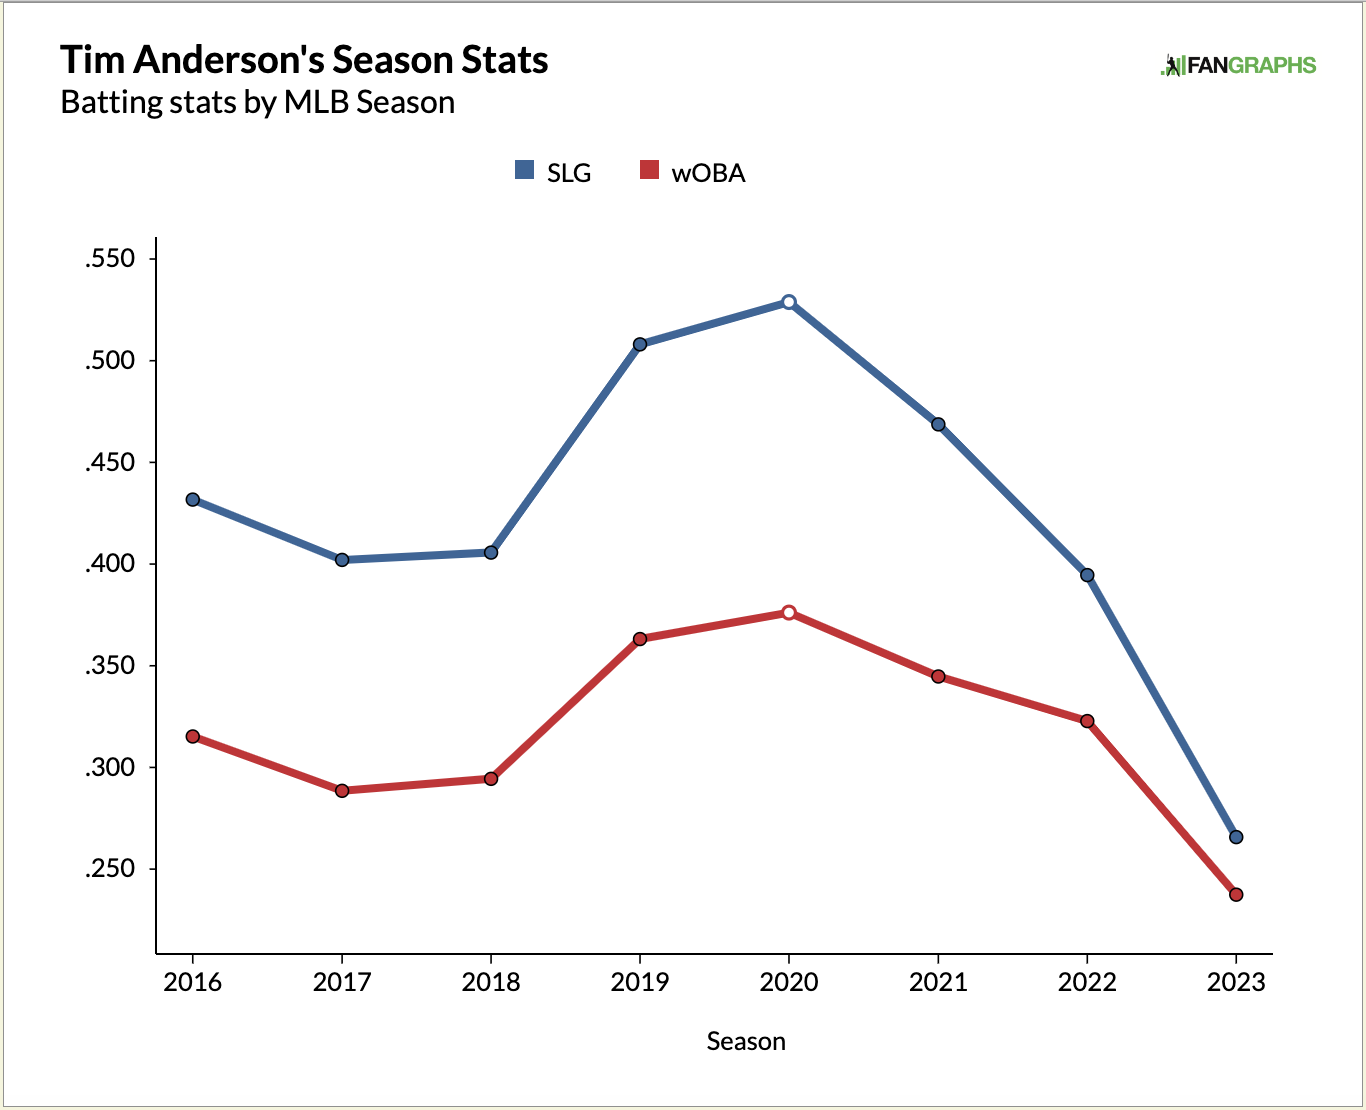
Some might speculate TA is playing through injury, some might speculate he is in an early stage skills decline at age 30. But, he is still walking better than his career average, striking out less than his career average, and swinging outside of the zone less than his career average. What he isn’t doing is swinging in the zone as often as he usually does and he is getting punished by sliders this season with a Pitch Info pVal of -13.5 on the pitch. He had real difficulty with sliders earlier in his career and he is facing them again. But, that doesn’t isolate his troubles. TA does not have a positive pVal on any one individual pitch this season. Whatever the reason for this decline is, many are hoping it will turn around soon.
Daulton Varsho, 1.00 P/G:
Varsho has hit a wOBA season low, so he has nowhere to go but up:
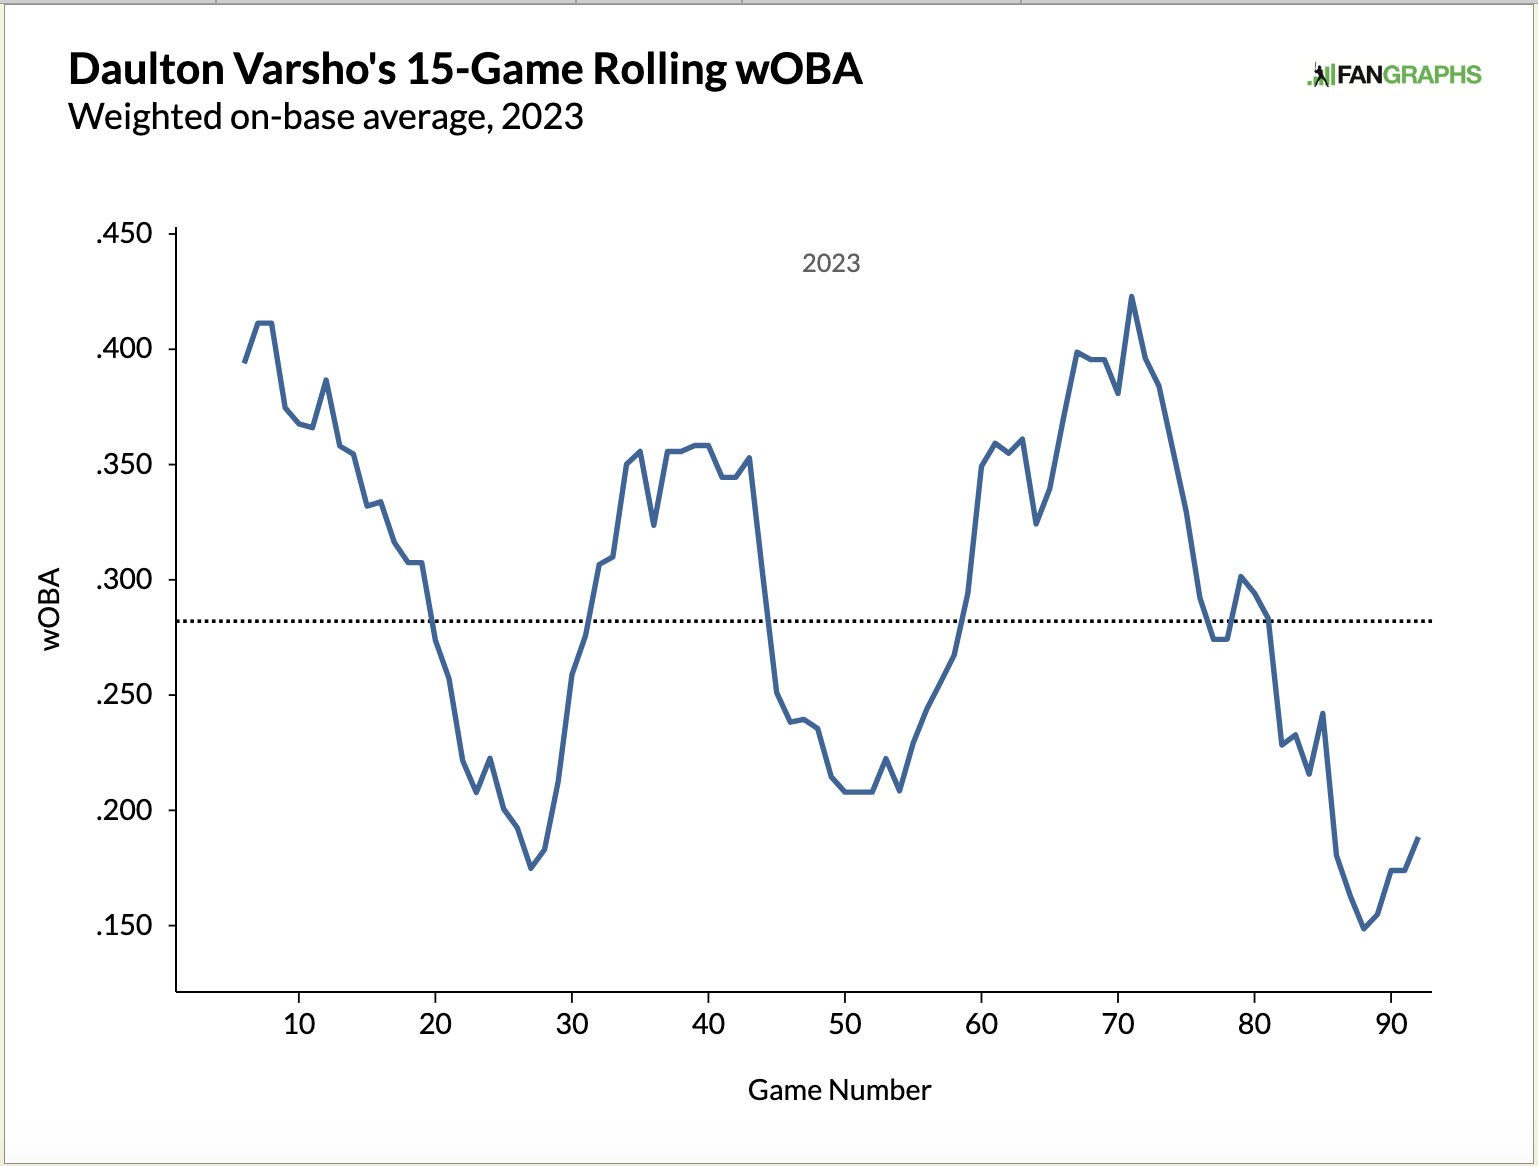
Varsho’s power metrics are missing the projected marks systems expected before the season began, particularly his slugging (.365) and ISO (.150). He does have 11 stolen bases on the year and that is nothing to complain about. He is still hitting the ball hard and even put up his best MaxEV mark of 112.5 MPH this season. All of his Statcast expected marks are greater than his actuals:
AVG: .215 xAVG: .232
SLG: .365 xSLG: .391
wOBA: .282 xwOBA: .303
He’ll need to improve his timing and ability to hit the fastball as it has given him some trouble this season (-9.3 PitchInfo pVal) and he’s only hitting .205 against righties (.259 against lefties). RosterResource lists him as a left-handed hitter in a projected platoon vs RHP.
Martín Pérez, 0.84 P/IP:
Pérez was skipped in his rotation start after an awful outing against the Astros where he threw 1.1 innings, gave up two walks, three home runs, and was tagged with six earned runs. He did not bounce back in his next start, only going five innings against the Guardians, walking four, giving up a home run, and getting tagged with another three earned runs. Between last season and this season, Pérez’s per nine ratios are all trending in the wrong direction:

He’s been able to somewhat stabilize the high BB/9 that started his 2023 season, but he’s still walking too many when it’s combined with a high home run rate.
Bobby Miller, 2.82 P/IP:
Miller had an incredible start to the season where he earned only two runs (no home runs) in his first four starting appearances (23 IP) but then hitters adjusted in his next four starts (21 IP) and he gave up 20 earned runs on four home runs. In his latest outing, he recovered nicely and put up five strikeouts, no home runs, and only one earned run in 4.2 innings, but left the game with an injury:
Miller is a 24-year-old right-handed pitcher with insanely good stuff and should be expected to go through these types of highs and lows in his rookie season.