August is Almost Here and You Need Stolen Bases
We all knew this season would be different. New rules have changed the accumulation of statistics for some players slightly and we knew that would happen during the draft season. We didn’t know exactly what we should be doing about it. If everyone is stealing more bases, then who do you draft? Ronald Acuña Jr., that’s who.
Since the 2011 season, only nine players have finished the year with at least 50 stolen bases and only four players have finished with at least 60. Dee Strange-Gordon stole 64 bases in 2014 and 60 bases in 2017, Jonathan Villar stole 62 in 2016, and Michael Bourn stole 61 in 2011. This season, in 2023, both Ronald Acuña Jr. (78) and Esteury Ruiz (67) are on pace (Games Played %) to join the list. If Acuña keeps pace, he’ll be only the fourth player this century to steal at least 70 bases, joining José Reyes (78 in 2007), Scott Podsednik (70 in 2004), and Jacoby Ellsbury (70 in 2009).
I hate to tell you this, but Acuña is already rostered in your league. So, for this analysis, I took him out. You’ll see from the list of players analyzed further down in the article, that I somewhat arbitrarily selected players I either thought could be available in shallow leagues, or could be low-value trade targets. So your Acuña/Corbin Carroll/Bobby Witt Jr. types are all hereby classified as cluster 3 players and are basically unavailable.
You need players that you can add to your team that will not hurt all the other categories, right? So, picking up a player like Jorge Mateo, as much as it pains me to admit this, is not a great idea if you care about all your other stats. In this analysis, I classified the batters who are either likely available on the waiver wire (in shallow leagues) or easier targets for trade. Using one of my favorite methods, a principal component analysis, I mashed ROS wOBA, HR, R, and RBI into one number and plotted it up against ROS stolen bases. But, before I did that, I also used a K-means classifier to put all of the players that have a stolen base ROS by the bat x’s projection greater than five into groups. This process allowed me to simply pass those players’ wOBA, HR, R, RBI, and SB ROS projections into a sorting model (K-means cluster) to categorize them more mathematically than if I were just clumping them into groups. At the end of this process, I had a two-column spreadsheet. One column representing one production number per player (principal component analysis, mashed ROS wOBA, HR, R, and RBI) and one number per player projecting the stolen bases they will accumulate from here on out. I plotted those two numbers together and included the cluster the player was placed into:
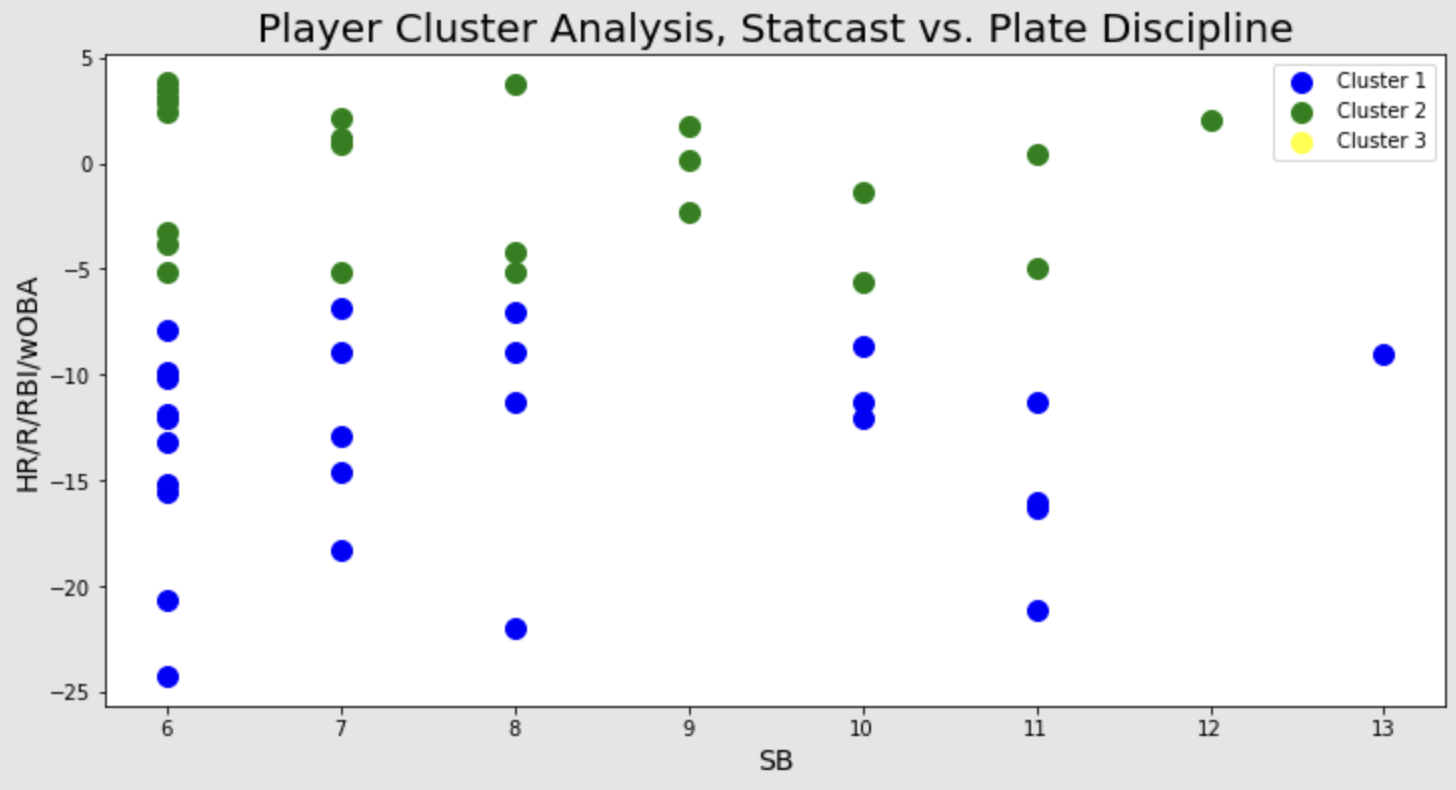
NOTE: cluster 3 players are the Acuña/Corbin Carroll/Bobby Witt Jr. types that you simply won’t be acquiring at this point in the season unless you offer to pay for your league-mates’ wedding.
Basically, the green players are better than the blue players by HR/R/RBI/wOBA ROS projections with the players in the green top right corner being the best. Here’s the difference on aggregate between blue (cluster 1) and green (cluster 2) players:
| Cluster | HR | R | RBI | wOBA | SB |
|---|---|---|---|---|---|
| 1 (Blue) | 3 | 20 | 14 | 0.303 | 8 |
| 2 (Green) | 6 | 28 | 24 | 0.318 | 8 |
When you go to the waiver wire and you sort by stolen bases, it can be difficult to get a full sense of what else that player has to offer. Don’t panic and just add whoever has stolen the most and is still available. You can do better. If you have to sacrifice two stolen bases to get two more home runs, it could be worth it. Obviously, it all depends on where you are in your standings, but more production (cluster 2) is never a bad thing. Take a look at the players who are expected to steal more than five the rest of the way, and that the cluster analysis thinks are better for your team:
| Name | HR | R | RBI | wOBA | SB |
|---|---|---|---|---|---|
| Ha-Seong Kim 김하성 | 7 | 32 | 26 | 0.322 | 8 |
| Anthony Volpe | 7 | 30 | 25 | 0.315 | 9 |
| Matt McLain | 8 | 29 | 27 | 0.340 | 6 |
| Trent Grisham | 9 | 30 | 26 | 0.333 | 6 |
| Harrison Bader | 8 | 30 | 25 | 0.309 | 12 |
| Jeremy Peña | 6 | 30 | 26 | 0.315 | 7 |
| Tyler O’Neill | 9 | 29 | 26 | 0.345 | 6 |
| Amed Rosario | 4 | 29 | 26 | 0.314 | 7 |
| Jose Siri | 8 | 27 | 25 | 0.304 | 9 |
| Nico Hoerner | 3 | 31 | 24 | 0.318 | 11 |
| Tim Anderson | 3 | 29 | 22 | 0.318 | 9 |
| Ezequiel Tovar | 7 | 31 | 27 | 0.329 | 6 |
| Leody Taveras | 6 | 29 | 22 | 0.304 | 10 |
| Javier Báez | 7 | 28 | 26 | 0.311 | 7 |
| Maikel Garcia | 4 | 25 | 21 | 0.309 | 8 |
| Bryson Stott | 4 | 25 | 21 | 0.311 | 6 |
| Tommy Pham | 6 | 26 | 22 | 0.335 | 6 |
| CJ Abrams | 5 | 25 | 20 | 0.292 | 10 |
| Whit Merrifield | 3 | 27 | 20 | 0.307 | 11 |
| Jake Fraley | 6 | 24 | 21 | 0.344 | 7 |
| Drew Waters | 6 | 25 | 22 | 0.308 | 6 |
| Lane Thomas | 8 | 30 | 27 | 0.323 | 6 |
| TJ Friedl | 5 | 26 | 21 | 0.315 | 8 |
Tyler O’Neill recently returned from a back injury, so it’s hard to say whether or not he’ll be running at the pace The Bat X expects him to. But, he’s the type of player that makes life a little bit easier when you find yourself in a stolen bases hole. O’Neill has great speed, may just hit nine more home runs, and has the best projected wOBA out of all cluster two players.
You want to see cluster one, don’t you? Ok…I’ll show you. But, it’s kind of like being on a road trip and stopping at an Exxon for snacks when you could have just driven an extra mile and gone to WaWa.
*The author of this article is, in no way, shape, or form, associated with any roadside gas stations.
| Name | HR | R | RBI | wOBA | SB |
|---|---|---|---|---|---|
| Tommy Edman | 4 | 24 | 17 | 0.323 | 10 |
| Jarren Duran | 5 | 25 | 18 | 0.335 | 8 |
| Kevin Kiermaier | 3 | 24 | 17 | 0.304 | 7 |
| Dylan Moore | 6 | 21 | 15 | 0.318 | 11 |
| Jon Berti | 2 | 20 | 11 | 0.307 | 11 |
| Jake McCarthy | 3 | 25 | 16 | 0.314 | 13 |
| Jorge Mateo | 3 | 18 | 12 | 0.294 | 11 |
| Manuel Margot | 4 | 21 | 18 | 0.313 | 6 |
| Thairo Estrada | 3 | 20 | 15 | 0.315 | 7 |
| Josh Lowe | 5 | 20 | 18 | 0.308 | 6 |
| Kyle Isbel | 5 | 23 | 20 | 0.304 | 7 |
| Brice Turang | 4 | 20 | 16 | 0.302 | 6 |
| Myles Straw | 0 | 24 | 15 | 0.291 | 10 |
| Oswald Peraza | 4 | 18 | 14 | 0.304 | 7 |
| Willi Castro | 3 | 18 | 13 | 0.311 | 6 |
| Geraldo Perdomo | 2 | 23 | 14 | 0.293 | 6 |
| Taylor Walls | 4 | 17 | 14 | 0.293 | 6 |
| Joey Wendle | 2 | 20 | 15 | 0.291 | 6 |
| Akil Baddoo | 4 | 22 | 15 | 0.307 | 8 |
| Dairon Blanco | 2 | 14 | 8 | 0.291 | 8 |
| Victor Robles | 4 | 22 | 14 | 0.297 | 10 |
| Will Benson | 6 | 22 | 19 | 0.323 | 6 |
| Raimel Tapia | 3 | 24 | 17 | 0.300 | 8 |
| Esteury Ruiz | 1 | 17 | 7 | 0.284 | 11 |
| Nicky Lopez | 0 | 16 | 9 | 0.283 | 6 |
| Ji Hwan Bae | 1 | 12 | 7 | 0.297 | 6 |
| Isiah Kiner-Falefa | 1 | 17 | 11 | 0.289 | 7 |
If you’re so far down in the stolen bases dumps this season that you are considering punting the category, consider what it would do to your totals if you moved one rank point up. Balance out what you have and what you need by considering the cluster two players from either the waiver wire or a low-level trade. Or, just offer your best hitter and best pitcher and next season’s first-round pick to take advantage of those extra 20 SBs Acuña may get.
Mr. Kelly. How can you write an entire SB article without mentioning the best in the MBL — Esteury Ruiz. I know he’s on the IL but is begging rehab games tomorrow. Still have more steals than most of the guys on your chart.
He did mention him in the second paragraph, but maybe like Acuna he thought that everyone had him rostered already.
..yea.
But, he’s also in the second table (cluster one, blue)
Ok. Stand corrected. That said, He’s stolen over 100 bases (Minors 2022 – Majors 2023). That’s Ricky Henderson territory.