A Way-Too-Early Look at the Importance of Bat Speed
This article takes a look at some of the new bat tracking metrics published this week at Baseball Savant. It aims to help readers incorporate the new metrics into their analysis toolkit.
Bat tracking metrics have now been published for 2024, starting on April 3rd. Last year, Baseball America published a test version of average bat speed as well. The operationalization of the bat tracking metrics has been tweaked since the Baseball America version was published, but so far, this is the data we have to work with.
I took the 2024 data for hitters and split it up into two halves: from April 3rd to April 23rd, and from April 24th to May 13th. I then looked at the correlation between various half-one bat tracking metrics and half-two wOBAcon. wOBAcon, or wOBA on contact, is an encompassing indicator of a hitter’s power performance that only considers plate appearances that end in a batted ball event. Historically, barrel rate per batted ball event has been the gold standard of power metrics, typically found to be a more powerful predictor of wOBAcon than any other metric. How do average bat speed and the other new bat tracking metrics stack up? Given we are dealing with small samples, I also looked at the correlation between various half-one bat tracking metrics and half-two xwOBAcon, a more reliable indicator than wOBAcon.
Table One. Correlations between first-half bat tracking measures and second-half outcomes.
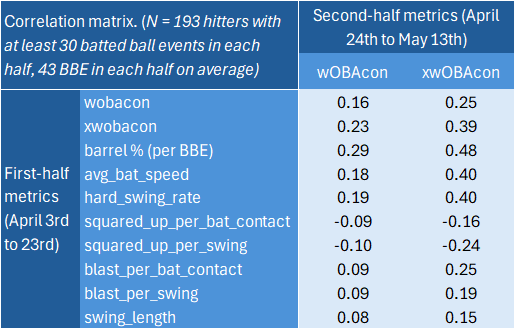
Interpretation: first-half wOBAcon is correlated with second-half wOBAcon at .16.
In terms of predictive power, barrel rate still reigns supreme, with a higher correlation to second-half power output (.29 with wOBAcon and .48 with xwOBAcon) than the bat tracking measures. However, average bat speed and hard swing rate do not lag far behind—impressive when considering they only capture the most fundamental attribute of a hitter, their swing. Blast and swing length also have weaker positive correlations to second-half wOBAcon, while the squared up metrics have a negative relationship with wOBAcon. The squared up metrics might be capturing contact over power, so it could be better to test them against second-half wOBA rather than second-half wOBAcon. Additionally, it might be sensible to interact the squared up metrics with average bat speed.
Looking at the preliminary 2023 average bat speed data (through September 10, 2023) from the Baseball America piece, the correlation between 2023 average bat speed and 2024 wOBAcon is .35, versus a .33 correlation for 2023 (also through September 10, 2023) barrel rate and 2024 wOBAcon (n = 320 hitters with at least 30 BBE and 70 PA through September 10, 2023 and at least 30 BBE in 2024). With a larger sample, then, average bat speed might threaten barrel rate’s reign of tyranny as king of the quality of contact metrics, but this remains to be seen.
Reliability is another key consideration when looking at the new bat tracking metrics. One easy way to measure this is to use a first-half metric to predict itself in the second half of our 2024 dataset. How much regression to the mean should be added to minimize predictive error (RMSE) when using a first-half metric to predict itself in the second half?
Table Two. Regression amounts.
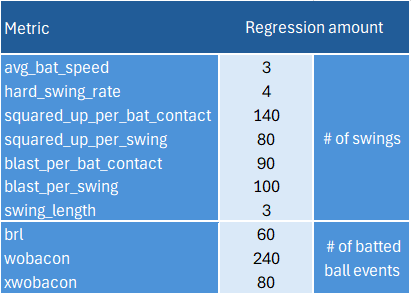
Collectively, the new bat tracking metrics are super sticky, with average bat speed and swing length requiring regression amounts of only three swings to minimize predictive error. MLBAM Sabermetrician Tom Tango found similar results—a regression amount of two swings for average bat speed—using a more rigorous method (splitting the sample randomly in half using pitch-level data). This is a comparable level of reliability to velocity for pitchers. The new bat tracking measures can tell us a lot about a hitter in a short amount of time. Barrel rate (per BBE) has a reputation for being one of the most reliable measures, with a regression amount of 60 batted ball events in this sample (a regression amount that is consistent with past research)—but there is no keeping up with the bat tracking measures in terms of reliability.
What if we consider multiple measures at the same time—how much does average bat speed tell us in comparison to barrel rate on its own? It is possible to use ordinary least squares regression weighted by sample size to answer this. Using the 2024 dataset, I first add in regression amounts to each first-half metric, then use weighted OLS (weighted by second-half batted ball events) to find correlations between regressed first-half metrics and (unregressed) second-half metrics. This is the same as looking at raw correlations like I did in Table One, but it’s a little more efficient since the correlations are now weighted by sample size (compared to using some arbitrary threshold, the weighted OLS approach allows me to make use of all available data).
Using this approach, the correlation between first-half barrel rate and second-half wOBAcon is .23, versus a .18 correlation between first-half average bat speed and second-half wOBAcon (also using this approach, the correlations between first-half hard swing rate and second-half wOBAcon, and first-half xwOBAcon and second-half wOBAcon, are .16 and .17, respectively). A one-mile-per-hour increase in first-half average bat speed is associated with an eight-point increase in second-half wOBAcon (p<.01); a one-percentage-point increase in first-half barrel rate is associated with a twelve-point increase in second-half wOBAcon (p<.01).
If I consider both barrel rate and average bat speed at the same time (regressing second-half wOBAcon on both measures together), the correlation jumps to .24—considering both measures adds predictive power, something that has already been found in previous research. Analyzing the Statcast era, Tango finds average bat speed in year one has a .224 correlation to wOBA in year two, while year-one xwOBA has a .446 correlation to year-two wOBA. Considering year-one average bat speed and year-one xwOBA together, the correlation to year-two wOBA improves to .455.
If we run this same exercise using the Baseball America data (covering the same sample highlighted earlier), the results are similar: the weighted correlation between 2023 barrel rate and 2024 wOBAcon is .37; the weighted correlation between 2023 average bat speed and 2024 wOBAcon is .36; the weighted correlation between both 2023 measures and 2024 wOBAcon is .40. A one-mile-per-hour increase in 2023 average bat speed is associated with an eleven-point increase in 2024 wOBAcon (p<.01); a one-percentage-point increase in 2023 barrel rate is associated with a nine-point increase in 2024 wOBAcon (p<.01).
Even a way-too-early look at the data makes it clear enough that analysts should aim to make use of all available data when trying to estimate a hitter’s “true-talent” power.