Archive for Meta Analysis

Who Plays in Doubleheaders?

This past weekend, I was trying to decide how much to lean into Oakland’s nine-game week. I didn’t know if just the regulars would start in all the games or should I focus on some of the lesser bats (there are many of them on Oakland). I figured this question would come up several times during the season, so I decided to get an overall view of who sits and plays.

I’ll apologize upfront for most of the article being a big data dump. If anyone is not interested in the numbers, just jump to “Conclusions” for my take on the information. Read the rest of this entry »

Bye Bye Fastballs and Curveballs, Hello Sliders

Yesterday, I dove into some of the hitting metrics to determine what has been driving the decline in offense. Today, let’s over to the pitching side and review another set of metrics. Obviously, we use a lot of the same metrics on each side, so I’ll only present and discuss those that weren’t shared yesterday.

Read the rest of this entry »


Offense Go Bye Bye

We’re about a month into the season (holy cow, seriously, it’s whizzed by so far!), and offense is down at levels we haven’t witnessed in a loooooong time. So I’m going to take a break from my usual player specific leader and laggard boards and review some leaguewide metrics. You may have noticed in your fantasy league standings that pitching ratios are significantly better than we’re used to. In my shallow 12-team mixed league, four teams are sitting pretty with a sub-3.00 ERA! Two teams have a sub-1.00 WHIP (I’m barely above at a 1.0057)…whaaaaaaaaaaat?! Even in my AL-Only Tout Wars, four teams have posted a sub-3.00 ERA, which is just insane! Naturally, these strong pitching results must mean that offense has been missing. Let’s review some of the most basic of metrics to find out what’s driving the decline in offense.

Read the rest of this entry »


Building a 2022 $9 NFBC Pitching Staff

Yesterday, I built a $14 NFBC offense using their average auction values, limiting myself to an entire squad of $1 hitters. Today, let’s now build a $9 pitching staff. I only had 58 pitchers to choose from, but I can guarantee that you will be so jealous of the squad I assembled, you will wish you had done the same in your 15-team league.

Read the rest of this entry »


Summation of 2021 Projection Accuracy

Earlier this offseason I examined the accuracy of several projections. I’m going to give my recommendations today on the best way to balance those findings between getting the best results and keeping the process simple. I’m going to focus on playing time and stats for pitchers and hitters. While there could a way to weigh every single stat of every projection, it’s just a waste of time in my opinion. The best answer is to aggregate the best options.

I know some people will want a more in-depth answer while the following will be too much for others. Some projections, like ATC, are already trying to perfect the mix and still fall short of a straight average. The cause for the disconnect is that some of the stand-alone projections are constantly improving. What may be the best projection mix in one season is suboptimal in the next. I’m willing to have 95% of the projection accuracy and instead spend my time looking for information that the projections might have missed. Read the rest of this entry »


2021 Review — Starting Pitcher xK% Overperformers

Yesterday, I shared my latest pitcher xK% equation and identified and discussed the nine starting pitchers that most underperformed those marks.

Read the rest of this entry »


What’s Worse in Roto, a .220 AVG or a 5.00 ERA?

Here is a tale of two tweets.

The first one tries to see if fantasy managers would consider rostering a great pitcher in every regard except they would have a 5.00 ERA.

And now the same options (I see the steam vs. stream mistake, my bad!) but for a hitter who is projected to have a .220 AVG.

The results are a stark difference. The deal is that a .220 AVG and a 5.00 ERA will hurt a roto team the same amount. While it may not be obvious, a little math might help. To determine the effects, I took the Standings Gain Points equations from 15-team redraft leagues from The Process (a great resource, you should buy it).

AVG SGP = ((1669+H)/(6525+AB)-0.256)/0.0012

ERA SGP = (((489+ER)*9)/(1122+IP)-3.92)/(-0.0566)

These formulas determine how much a fantasy team would move up and down the standings based on the rate stat. The volume does matter since it’s worse to add 150 innings of a 5.00 ERA to a team than just 20 innings. Read the rest of this entry »


Introducing the Newest Hitter xBABIP

It’s been a looooooooong journey toward understanding what underlying skills drive a hitter’s BABIP ability. No matter how much understanding we have gained over the years, it has been a struggle to develop an equation that produced an R-squared much over 0.50. That’s not terrible, but when my hitter xHR/FB equation spits out an impressive 0.826 R-Squared, I continue to strive for better. I shared my last hitter xBABIP equation almost exactly five years ago, and since, I have yet to see a better one.

Read the rest of this entry »


2021 Review: Hitter Pull FB% Leaders

Let’s continue diving into the components of my hitter xHR/FB equation by reviewing the 2021 leaders in Pull FB% (PFB). This is the percentage of a hitter’s fly balls that are pulled. For home runs, the higher the PFB, the better…for the most part (there are always exceptions). Why? In the Statcast era (since 2015), average distance of fly balls by batted ball direction were as follows:

Avg Fly Ball Distance by Batted Ball Direction
Direction Avg Dist in Feet (2015-2021)
Pull 342
Straightaway 329
Opposite 292

Those are some serious differences solely based on the fly ball’s horizontal direction. Since hitters hit the ball further, on average, when they pull their flies, then a higher rate of pulled flies should typically result in a higher HR/FB rate. So let’s now review the 2021 PFB leaders (minimum 20 fly balls).

Read the rest of this entry »


Estimating Pitch Results from a Small Sample

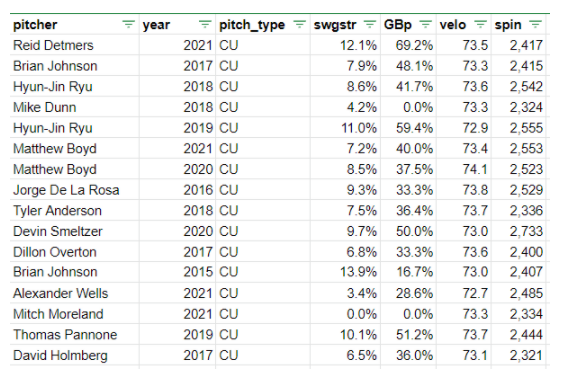
A few days ago, I wrote an article examining Reid Detmers. For Detmers, I posted the following table on comparable curveballs and the lack of results.

Read the rest of this entry »